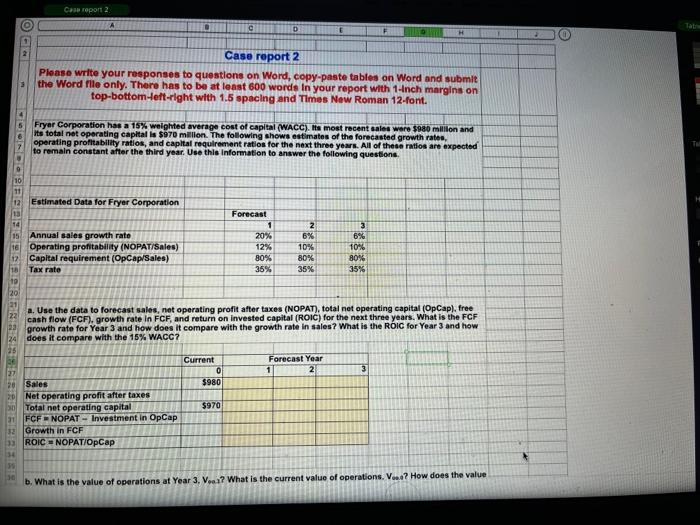
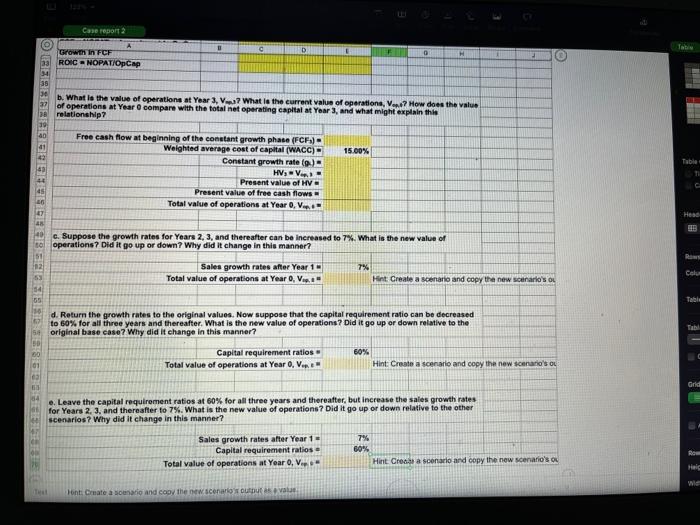
Case report 2 A D Tat: OG le E e Case report 2 Please write your responses to questions on Word, copy-paste tables on Word and submit the Word file only. There has to be at least 600 words in your report with 1-Inch margins on top-bottom-left-right with 1.5 spacing and Times New Roman 12-font. Fryer Corporation has a 15% weighted average cost of capital (WACC). Its most recent sales were $980 million and its total net operating capital is $970 million. The following shows estimates of the forecasted growth rates, operating profitability ratios, and capital requirement ratios for the next three years. All of these tos are expected to remain constant after the third year. Use this information to answer the following questions Estimated Data for Fryer Corporation Annual sales growth rate 16 Operating profitability (NOPAT/Sales) Capital requirement (OpCap/Sales) Tax rate Forecast 1 20% 12% 80% 35% Z 6% 10% 80% 35% 3 6% 10% 80% 35% 20 SOONDO SEBEBASSESSEREBBE SE a. Use the data to forecast sales, net operating profit after taxes (NOPAT), total net operating capital (OpCap), free cash flow (FCF), growth rate In FCF, and return on invested capital (ROI) for the next three years. What is the FCF growth rate for Year 3 and how does it compare with the growth rate in sales? What is the ROIC for Year 3 and how 24 does it compare with the 15% WACC? Forecast Year 1 2 3 Current 0 Sales $980 20 Net operating profit after taxes Total net operating capital $970 FCF NOPAT - Investment in OpCap 13 Growth in FCF 33 ROIC = NOPATIOpCap b. What is the value of operations at Year 3. V...? What is the current value of operations, V...? How does the value Case report 2 C D Tatia F Growth In FCF 33 ROIC NOPATIOpCap 1 2 b. What is the value of operations at Year 3, V7 What is the current value of operations, Vax? How does the value 37 of operations at Year 0 compare with the total net operating capital Mt Year 3, and what might explain this 30 relationship? 40 01 15.00% 42 Tablet Free cash flow at beginning of the constant growth phase (FCF) - Weighted average cost of capital (WACC) Constant growth rate :) HV, - Present Value of HV Present value of free cash flows Total value of operations at Year 0. V... Head EIE 40 c. Suppose the growth rates for Years 2, 3, and thereafter can be increased to 7%. What is the new value of to operations? Did It go up or down? Why did it change in this manner? @ 2 7% Sales growth rates after Year 10 Total value of operations at Year 0. V. Colul 53 Hint Create a scenario and copy the new scenario's ou Tabalu d. Return the growth rates to the original values. Now suppose that the capital requirement ratio can be decreased to 50% for all three years and thereafter. What is the new value of operations? Did it go up or down relative to the 54 original base caso? Why did it change in this manner? Capital requirement ratios 60% 01 Total value of operations at Year O, V... Hint: Create a scenario and copy the new scenario's ou Grid 54 . Leave the capital requirement ratios at 60% for all three years and thereafter, but increase the sales growth rates for Years 2, 3, and thereafter to 7%. What is the new value of operations? Did it go up or down relative to the other scenarios? Why did it change in this manner? 7% Sales growth rates after Year 1 - Capital requirement ratios - Total value of operations at Year, V.. 60% RO Hint Cres a scenario and copy the new scenario's ou Hic we Font: Create a song and copy the new scenarios outsi Case report 2 A D Tat: OG le E e Case report 2 Please write your responses to questions on Word, copy-paste tables on Word and submit the Word file only. There has to be at least 600 words in your report with 1-Inch margins on top-bottom-left-right with 1.5 spacing and Times New Roman 12-font. Fryer Corporation has a 15% weighted average cost of capital (WACC). Its most recent sales were $980 million and its total net operating capital is $970 million. The following shows estimates of the forecasted growth rates, operating profitability ratios, and capital requirement ratios for the next three years. All of these tos are expected to remain constant after the third year. Use this information to answer the following questions Estimated Data for Fryer Corporation Annual sales growth rate 16 Operating profitability (NOPAT/Sales) Capital requirement (OpCap/Sales) Tax rate Forecast 1 20% 12% 80% 35% Z 6% 10% 80% 35% 3 6% 10% 80% 35% 20 SOONDO SEBEBASSESSEREBBE SE a. Use the data to forecast sales, net operating profit after taxes (NOPAT), total net operating capital (OpCap), free cash flow (FCF), growth rate In FCF, and return on invested capital (ROI) for the next three years. What is the FCF growth rate for Year 3 and how does it compare with the growth rate in sales? What is the ROIC for Year 3 and how 24 does it compare with the 15% WACC? Forecast Year 1 2 3 Current 0 Sales $980 20 Net operating profit after taxes Total net operating capital $970 FCF NOPAT - Investment in OpCap 13 Growth in FCF 33 ROIC = NOPATIOpCap b. What is the value of operations at Year 3. V...? What is the current value of operations, V...? How does the value Case report 2 C D Tatia F Growth In FCF 33 ROIC NOPATIOpCap 1 2 b. What is the value of operations at Year 3, V7 What is the current value of operations, Vax? How does the value 37 of operations at Year 0 compare with the total net operating capital Mt Year 3, and what might explain this 30 relationship? 40 01 15.00% 42 Tablet Free cash flow at beginning of the constant growth phase (FCF) - Weighted average cost of capital (WACC) Constant growth rate :) HV, - Present Value of HV Present value of free cash flows Total value of operations at Year 0. V... Head EIE 40 c. Suppose the growth rates for Years 2, 3, and thereafter can be increased to 7%. What is the new value of to operations? Did It go up or down? Why did it change in this manner? @ 2 7% Sales growth rates after Year 10 Total value of operations at Year 0. V. Colul 53 Hint Create a scenario and copy the new scenario's ou Tabalu d. Return the growth rates to the original values. Now suppose that the capital requirement ratio can be decreased to 50% for all three years and thereafter. What is the new value of operations? Did it go up or down relative to the 54 original base caso? Why did it change in this manner? Capital requirement ratios 60% 01 Total value of operations at Year O, V... Hint: Create a scenario and copy the new scenario's ou Grid 54 . Leave the capital requirement ratios at 60% for all three years and thereafter, but increase the sales growth rates for Years 2, 3, and thereafter to 7%. What is the new value of operations? Did it go up or down relative to the other scenarios? Why did it change in this manner? 7% Sales growth rates after Year 1 - Capital requirement ratios - Total value of operations at Year, V.. 60% RO Hint Cres a scenario and copy the new scenario's ou Hic we Font: Create a song and copy the new scenarios outsi