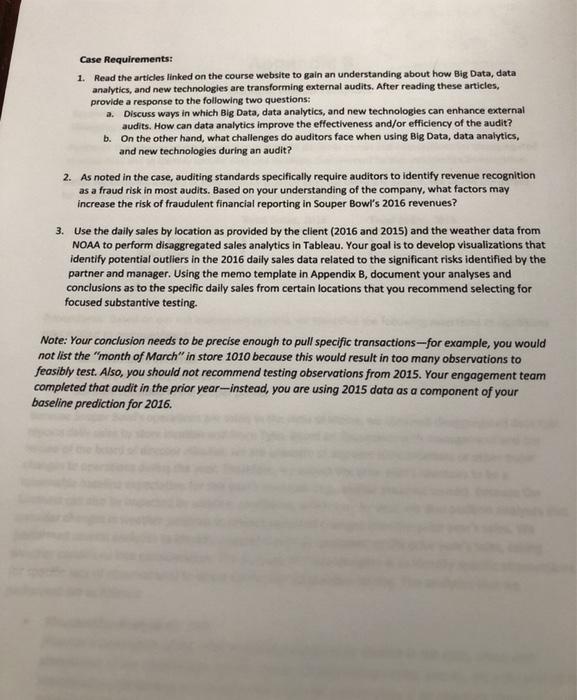
Case Requirements: 1. Read the articles linked on the course website to gain an understanding about how Big Data, data analytics, and new technologies are transforming external audits. After reading these articles, provide a response to the following two questions: a. Discuss ways in which Big Data, data analytics, and new technologies can enhance external audits. How can data analytics improve the effectiveness and/or efficiency of the audit? b. On the other hand, what challenges do auditors face when using Big Data, data analytics, and new technologies during an audit? 2. As noted in the case, auditing standards specifically require auditors to identify revenue recognition as a fraud risk in most audits. Based on your understanding of the company, what factors may increase the risk of fraudulent financial reporting in Souper Bowl's 2016 revenues? 3. Use the daily sales by location as provided by the client (2016 and 2015) and the weather data from NOAA to perform disaggregated sales analytics in Tableau. Your goal is to develop visualizations that identify potential outliers in the 2016 daily sales data related to the significant risks identified by the partner and manager. Using the memo template in Appendix B, document your analyses and conclusions as to the specific daily sales from certain locations that you recommend selecting for focused substantive testing. Note: Your conclusion needs to be precise enough to pull specific transactions--for example, you would not list the "month of March" in store 1010 because this would result in too many observations to feasibly test. Also, you should not recommend testing observations from 2015. Your engagement team completed that oudit in the prior year-instead, you are using 2015 data as a component of your baseline prediction for 2016. Case Requirements: 1. Read the articles linked on the course website to gain an understanding about how Big Data, data analytics, and new technologies are transforming external audits. After reading these articles, provide a response to the following two questions: a. Discuss ways in which Big Data, data analytics, and new technologies can enhance external audits. How can data analytics improve the effectiveness and/or efficiency of the audit? b. On the other hand, what challenges do auditors face when using Big Data, data analytics, and new technologies during an audit? 2. As noted in the case, auditing standards specifically require auditors to identify revenue recognition as a fraud risk in most audits. Based on your understanding of the company, what factors may increase the risk of fraudulent financial reporting in Souper Bowl's 2016 revenues? 3. Use the daily sales by location as provided by the client (2016 and 2015) and the weather data from NOAA to perform disaggregated sales analytics in Tableau. Your goal is to develop visualizations that identify potential outliers in the 2016 daily sales data related to the significant risks identified by the partner and manager. Using the memo template in Appendix B, document your analyses and conclusions as to the specific daily sales from certain locations that you recommend selecting for focused substantive testing. Note: Your conclusion needs to be precise enough to pull specific transactions--for example, you would not list the "month of March" in store 1010 because this would result in too many observations to feasibly test. Also, you should not recommend testing observations from 2015. Your engagement team completed that oudit in the prior year-instead, you are using 2015 data as a component of your baseline prediction for 2016


