

Answered step by step
Verified Expert Solution
Question
1 Approved Answer
CASE Risk Pooling ACME, a company that produces and distributes electronic equipment in the Northeast of the United States, faces a distribution problem. The current
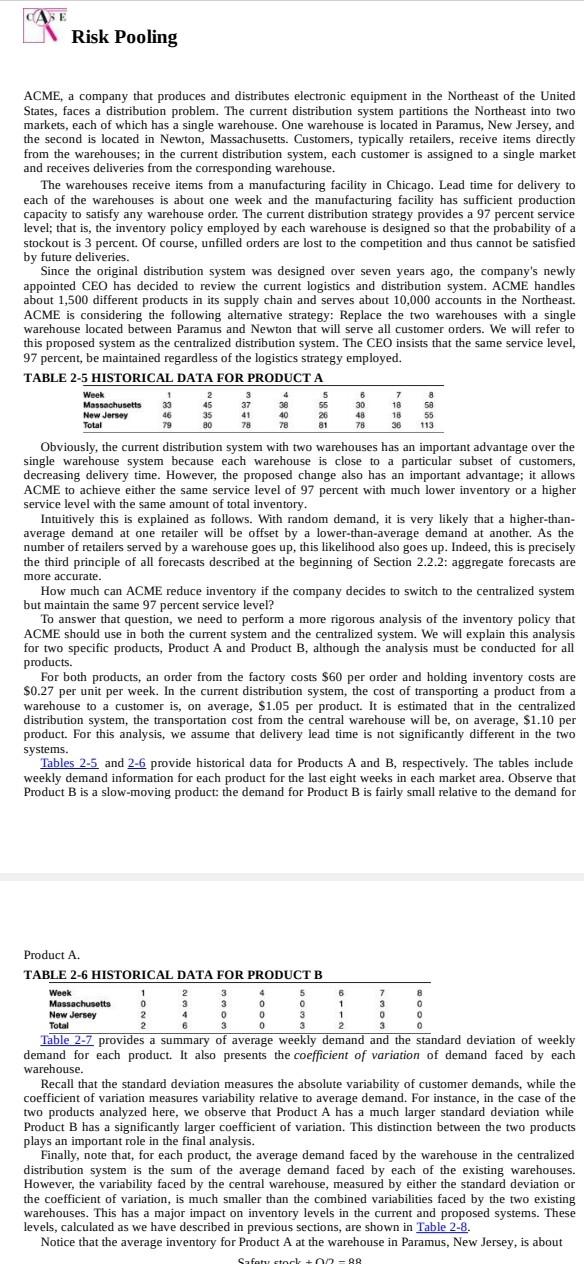
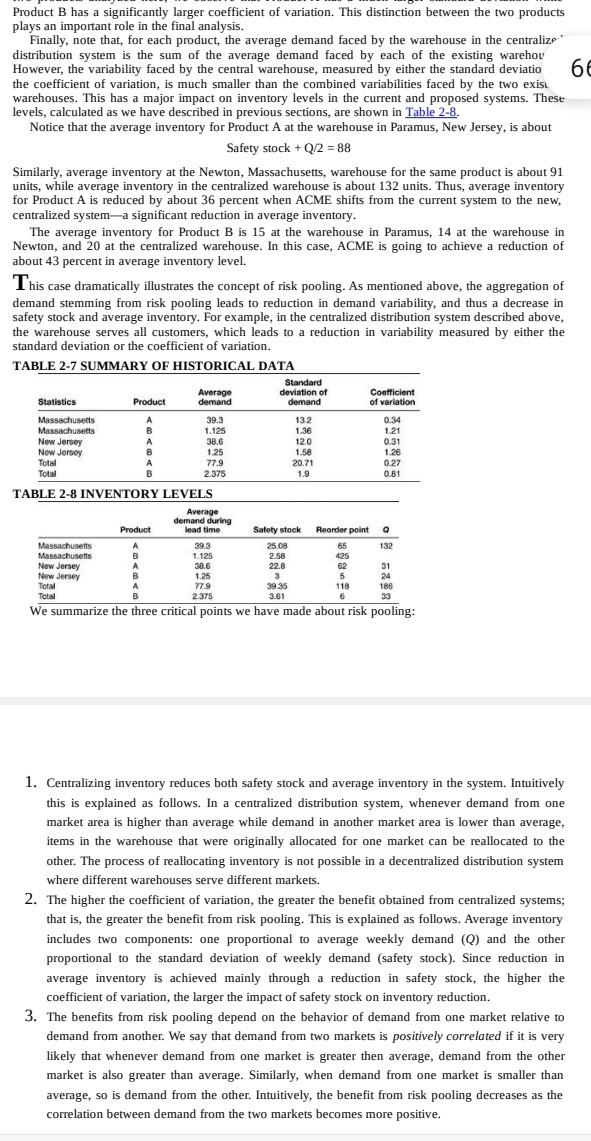
CASE Risk Pooling ACME, a company that produces and distributes electronic equipment in the Northeast of the United States, faces a distribution problem. The current distribution system partitions the Northeast into two markets, each of which has a single warehouse. One warehouse is located in Paramus, New Jersey, and the second is located in Newton, Massachusetts. Customers, typically retailers, receive items directly from the warehouses; in the current distribution system, each customer is assigned to a single market and receives deliveries from the corresponding warehouse. The warehouses receive items from a manufacturing facility in Chicago. Lead time for delivery to each of the warehouses is about one week and the manufacturing facility has sufficient production capacity to satisfy any warehouse order. The current distribution strategy provides a 97 percent service level; that is, the inventory policy employed by each warehouse is designed so that the probability of a stockout is 3 percent. Of course, unfilled orders are lost to the competition and thus cannot be satisfied by future deliveries. Since the original distribution system was designed over seven years ago, the company's newly appointed CEO has decided to review the current logistics and distribution system. ACME handles about 1,500 different products in its supply chain and serves about 10,000 accounts in the Northeast. ACME is considering the following altemative strategy: Replace the two warehouses with a single warehouse located between Paramus and Newton that will serve all customer orders. We will refer to this proposed system as the centralized distribution system. The CEO insists that the same service level, 97 percent, be maintained regardless of the logistics strategy employed. TABLE 2-5 HISTORICAL DATA FOR PRODUCT A 7 Massachusetts New Jersey Week 1 33 46 79 2 45 35 80 3 37 41 78 4 . 38 40 78 5 55 26 81 6 30 48 78 7 18 18 36 8 8 58 55 113 Total Obviously, the current distribution system with two warehouses has an important advantage over the single warehouse system because each warehouse is close to a particular subset of customers, decreasing delivery time. However, the proposed change also has an important advantage; it allows ACME to achieve either the same service level of 97 percent with much lower inventory or a higher service level with the same amount of total inventory. Intuitively this is explained as follows. With random demand, it is very likely that a higher-than- average demand at one retailer will be offset by a lower-than-average demand at another. As the number of retailers served by a warehouse goes up, this likelihood also goes up. Indeed, this is precisely the third principle of all forecasts described at the beginning of Section 2.2.2: aggregate forecasts are more accurate. How much can ACME reduce inventory if the company decides to switch to the centralized system but maintain the same 97 percent service level? To answer that question, we need to perform a more rigorous analysis of the inventory policy that ACME should use in both the current system and the centralized system. We will explain this analysis for two specific products, Product A and Product B, although the analysis must be conducted for all products. For both products, an order from the factory costs $60 per order and holding inventory costs are $0.27 per unit per week. In the current distribution system, the cost of transporting a product from a warehouse to a customer is, on average, $1.05 per product. It is estimated that in the centralized distribution system, the transportation cost from the central warehouse will be, on average, $1.10 per product. For this analysis, we assume that delivery lead time is not significantly different in the two systems Tables 2-5 and 2-6 provide historical data for Products A and B, respectively. The tables include weekly demand information for each product for the last eight weeks in each market area. Observe that Product B is a slow-moving product: the demand for Product B is fairly small relative to the demand for 6 1 1 2 3 0 3 0 0 Product A. TABLE 2-6 HISTORICAL DATA FOR PRODUCT B Week 1 4 5 5 7 8 Massachusetts 0 3 0 0 New Jersey 2 4 0 0 3 Total 6 3 0 3 0 Table 2-7 provides a summary of average weekly demand and the standard deviation of weekly demand for each product. It also presents the coefficient of variation of demand faced by each warehouse. Recall that the standard deviation measures the absolute variability of customer demands, while the coefficient of variation measures variability relative to average demand. For instance, in the case of the two products analyzed here, we observe that Product A has a much larger standard deviation while Product B has a significantly larger coefficient of variation. This distinction between the two products plays an important role in the final analysis. Finally, note that, for each product, the average demand faced by the warehouse in the centralized distribution system is the sum of the average demand faced by each of the existing warehouses. However, the variability faced by the central warehouse, measured by either the standard deviation or the coefficient of variation, is much smaller than the combined variabilities faced by the two existing warehouses. This has a major impact on inventory levels in the current and proposed systems. These levels, calculated as we have described in previous sections, are shown in Table 2-8. Notice that the average inventory for Product A at the warehouse in Paramus, New Jersey, is about Safety storl+02-09 Product B has a significantly larger coefficient of variation. This distinction between the two products plays an important role in the final analysis. Finally, note that, for each product, the average demand faced by the warehouse in the centralize distribution system is the sum of the average demand faced by each of the existing warehou However, the variability faced by the central warehouse, measured by either the standard deviatio 6 the coefficient of variation, is much smaller than the combined variabilities faced by the two exist warehouses. This has a major impact on inventory levels in the current and proposed systems. These levels, calculated as we have described in previous sections, are shown in Table 2-8. Notice that the average inventory for Product A at the warehouse in Paramus, New Jersey, is about Safety stock +Q/2 = 88 Similarly, average inventory at the Newton, Massachusetts, warehouse for the same product is about 91 units, while average inventory in the centralized warehouse is about 132 units. Thus, average inventory for Product A is reduced by about 36 percent when ACME shifts from the current system to the new, centralized systema significant reduction in average inventory. The average inventory for Product B is 15 at the warehouse in Paramus, 14 at the warehouse in Newton, and 20 at the centralized warehouse. In this case, ACME is going to achieve a reduction of about 43 percent in average inventory level. This case dramatically illustrates the concept of risk pooling. As mentioned above, the aggregation of demand stemming from risk pooling leads to reduction in demand variability, and thus a decrease in safety stock and average inventory. For example, in the centralized distribution system described above, the warehouse serves all customers, which leads to a reduction in variability measured by either the standard deviation or the coefficient of variation. TABLE 2-7 SUMMARY OF HISTORICAL DATA Standard deviation of demand Coefficient of variation 13.2 1.36 120 1.58 20.71 1.9 0.34 1.21 0.31 1.26 0.27 0.81 Average Statistics Product demand Massachusetts A 39.3 Massachusetts B 1.125 New Jersey A 38.6 New Jersey B 1.25 Total A 77.9 Total 2.375 TABLE 2-8 INVENTORY LEVELS Average demand during Product lead time Massachusetts A 393 Massachusetts R 1.125 New Jersey A 38.6 New Jersey B 1.25 Total 77.9 Total B 2.375 Satety stock 132 25.08 2.58 22.8 3 39.35 3.81 Reorder point 65 425 62 5 118 6 31 24 186 33 We summarize the three critical points we have made about risk pooling: 1. Centralizing inventory reduces both safety stock and average inventory in the system. Intuitively this is explained as follows. In a centralized distribution system, whenever demand from one market area is higher than average while demand in another market area is lower than average, items in the warehouse that were originally allocated for one market can be reallocated to the other. The process of reallocating inventory is not possible in a decentralized distribution system where different warehouses serve different markets. 2. The higher the coefficient of variation, the greater the benefit obtained from centralized systems; that is, the greater the benefit from risk pooling. This is explained as follows. Average inventory includes two components: one proportional to average weekly demand (Q) and the other proportional to the standard deviation of weekly demand (safety stock). Since reduction in average inventory is achieved mainly through a reduction in safety stock, the higher the coefficient of variation, the larger the impact of safety stock on inventory reduction. 3. The benefits from risk pooling depend on the behavior of demand from one market relative to demand from another. We say that demand from two markets is positively correlated if it is very likely that whenever demand from one market is greater then average, demand from the other market is also greater than average. Similarly, when demand from one market is smaller than average, so is demand from the other. Intuitively, the benefit from risk pooling decreases as the correlation between demand from the two markets becomes more positive. CASE Risk Pooling ACME, a company that produces and distributes electronic equipment in the Northeast of the United States, faces a distribution problem. The current distribution system partitions the Northeast into two markets, each of which has a single warehouse. One warehouse is located in Paramus, New Jersey, and the second is located in Newton, Massachusetts. Customers, typically retailers, receive items directly from the warehouses; in the current distribution system, each customer is assigned to a single market and receives deliveries from the corresponding warehouse. The warehouses receive items from a manufacturing facility in Chicago. Lead time for delivery to each of the warehouses is about one week and the manufacturing facility has sufficient production capacity to satisfy any warehouse order. The current distribution strategy provides a 97 percent service level; that is, the inventory policy employed by each warehouse is designed so that the probability of a stockout is 3 percent. Of course, unfilled orders are lost to the competition and thus cannot be satisfied by future deliveries. Since the original distribution system was designed over seven years ago, the company's newly appointed CEO has decided to review the current logistics and distribution system. ACME handles about 1,500 different products in its supply chain and serves about 10,000 accounts in the Northeast. ACME is considering the following altemative strategy: Replace the two warehouses with a single warehouse located between Paramus and Newton that will serve all customer orders. We will refer to this proposed system as the centralized distribution system. The CEO insists that the same service level, 97 percent, be maintained regardless of the logistics strategy employed. TABLE 2-5 HISTORICAL DATA FOR PRODUCT A 7 Massachusetts New Jersey Week 1 33 46 79 2 45 35 80 3 37 41 78 4 . 38 40 78 5 55 26 81 6 30 48 78 7 18 18 36 8 8 58 55 113 Total Obviously, the current distribution system with two warehouses has an important advantage over the single warehouse system because each warehouse is close to a particular subset of customers, decreasing delivery time. However, the proposed change also has an important advantage; it allows ACME to achieve either the same service level of 97 percent with much lower inventory or a higher service level with the same amount of total inventory. Intuitively this is explained as follows. With random demand, it is very likely that a higher-than- average demand at one retailer will be offset by a lower-than-average demand at another. As the number of retailers served by a warehouse goes up, this likelihood also goes up. Indeed, this is precisely the third principle of all forecasts described at the beginning of Section 2.2.2: aggregate forecasts are more accurate. How much can ACME reduce inventory if the company decides to switch to the centralized system but maintain the same 97 percent service level? To answer that question, we need to perform a more rigorous analysis of the inventory policy that ACME should use in both the current system and the centralized system. We will explain this analysis for two specific products, Product A and Product B, although the analysis must be conducted for all products. For both products, an order from the factory costs $60 per order and holding inventory costs are $0.27 per unit per week. In the current distribution system, the cost of transporting a product from a warehouse to a customer is, on average, $1.05 per product. It is estimated that in the centralized distribution system, the transportation cost from the central warehouse will be, on average, $1.10 per product. For this analysis, we assume that delivery lead time is not significantly different in the two systems Tables 2-5 and 2-6 provide historical data for Products A and B, respectively. The tables include weekly demand information for each product for the last eight weeks in each market area. Observe that Product B is a slow-moving product: the demand for Product B is fairly small relative to the demand for 6 1 1 2 3 0 3 0 0 Product A. TABLE 2-6 HISTORICAL DATA FOR PRODUCT B Week 1 4 5 5 7 8 Massachusetts 0 3 0 0 New Jersey 2 4 0 0 3 Total 6 3 0 3 0 Table 2-7 provides a summary of average weekly demand and the standard deviation of weekly demand for each product. It also presents the coefficient of variation of demand faced by each warehouse. Recall that the standard deviation measures the absolute variability of customer demands, while the coefficient of variation measures variability relative to average demand. For instance, in the case of the two products analyzed here, we observe that Product A has a much larger standard deviation while Product B has a significantly larger coefficient of variation. This distinction between the two products plays an important role in the final analysis. Finally, note that, for each product, the average demand faced by the warehouse in the centralized distribution system is the sum of the average demand faced by each of the existing warehouses. However, the variability faced by the central warehouse, measured by either the standard deviation or the coefficient of variation, is much smaller than the combined variabilities faced by the two existing warehouses. This has a major impact on inventory levels in the current and proposed systems. These levels, calculated as we have described in previous sections, are shown in Table 2-8. Notice that the average inventory for Product A at the warehouse in Paramus, New Jersey, is about Safety storl+02-09 Product B has a significantly larger coefficient of variation. This distinction between the two products plays an important role in the final analysis. Finally, note that, for each product, the average demand faced by the warehouse in the centralize distribution system is the sum of the average demand faced by each of the existing warehou However, the variability faced by the central warehouse, measured by either the standard deviatio 6 the coefficient of variation, is much smaller than the combined variabilities faced by the two exist warehouses. This has a major impact on inventory levels in the current and proposed systems. These levels, calculated as we have described in previous sections, are shown in Table 2-8. Notice that the average inventory for Product A at the warehouse in Paramus, New Jersey, is about Safety stock +Q/2 = 88 Similarly, average inventory at the Newton, Massachusetts, warehouse for the same product is about 91 units, while average inventory in the centralized warehouse is about 132 units. Thus, average inventory for Product A is reduced by about 36 percent when ACME shifts from the current system to the new, centralized systema significant reduction in average inventory. The average inventory for Product B is 15 at the warehouse in Paramus, 14 at the warehouse in Newton, and 20 at the centralized warehouse. In this case, ACME is going to achieve a reduction of about 43 percent in average inventory level. This case dramatically illustrates the concept of risk pooling. As mentioned above, the aggregation of demand stemming from risk pooling leads to reduction in demand variability, and thus a decrease in safety stock and average inventory. For example, in the centralized distribution system described above, the warehouse serves all customers, which leads to a reduction in variability measured by either the standard deviation or the coefficient of variation. TABLE 2-7 SUMMARY OF HISTORICAL DATA Standard deviation of demand Coefficient of variation 13.2 1.36 120 1.58 20.71 1.9 0.34 1.21 0.31 1.26 0.27 0.81 Average Statistics Product demand Massachusetts A 39.3 Massachusetts B 1.125 New Jersey A 38.6 New Jersey B 1.25 Total A 77.9 Total 2.375 TABLE 2-8 INVENTORY LEVELS Average demand during Product lead time Massachusetts A 393 Massachusetts R 1.125 New Jersey A 38.6 New Jersey B 1.25 Total 77.9 Total B 2.375 Satety stock 132 25.08 2.58 22.8 3 39.35 3.81 Reorder point 65 425 62 5 118 6 31 24 186 33 We summarize the three critical points we have made about risk pooling: 1. Centralizing inventory reduces both safety stock and average inventory in the system. Intuitively this is explained as follows. In a centralized distribution system, whenever demand from one market area is higher than average while demand in another market area is lower than average, items in the warehouse that were originally allocated for one market can be reallocated to the other. The process of reallocating inventory is not possible in a decentralized distribution system where different warehouses serve different markets. 2. The higher the coefficient of variation, the greater the benefit obtained from centralized systems; that is, the greater the benefit from risk pooling. This is explained as follows. Average inventory includes two components: one proportional to average weekly demand (Q) and the other proportional to the standard deviation of weekly demand (safety stock). Since reduction in average inventory is achieved mainly through a reduction in safety stock, the higher the coefficient of variation, the larger the impact of safety stock on inventory reduction. 3. The benefits from risk pooling depend on the behavior of demand from one market relative to demand from another. We say that demand from two markets is positively correlated if it is very likely that whenever demand from one market is greater then average, demand from the other market is also greater than average. Similarly, when demand from one market is smaller than average, so is demand from the other. Intuitively, the benefit from risk pooling decreases as the correlation between demand from the two markets becomes more positive
Step by Step Solution
There are 3 Steps involved in it
Step: 1

Get Instant Access to Expert-Tailored Solutions
See step-by-step solutions with expert insights and AI powered tools for academic success
Step: 2

Step: 3
Ace Your Homework with AI
Get the answers you need in no time with our AI-driven, step-by-step assistance
Get Started
Multinational financial management
Authors: Alan c. Shapiro
10th edition
9781118801161, 1118572386, 1118801164, 978-1118572382