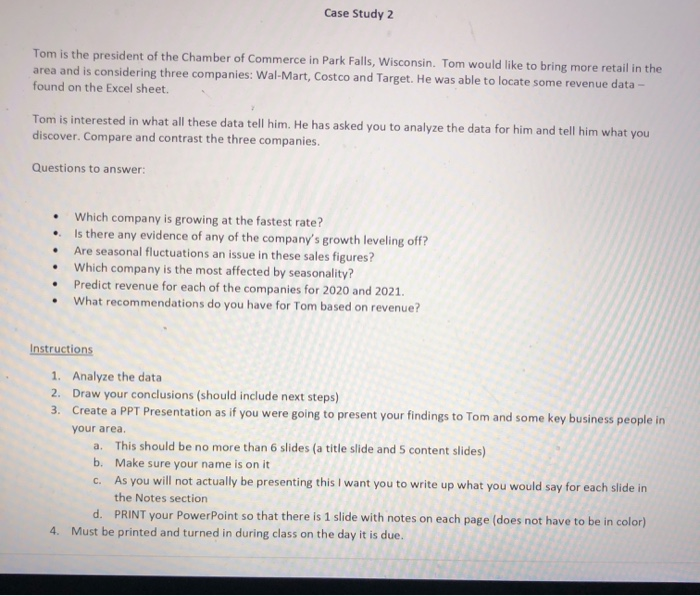
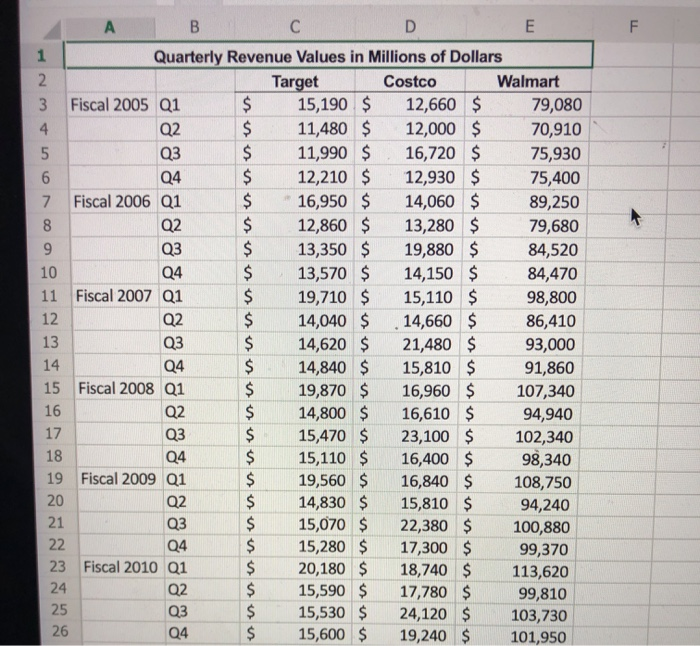
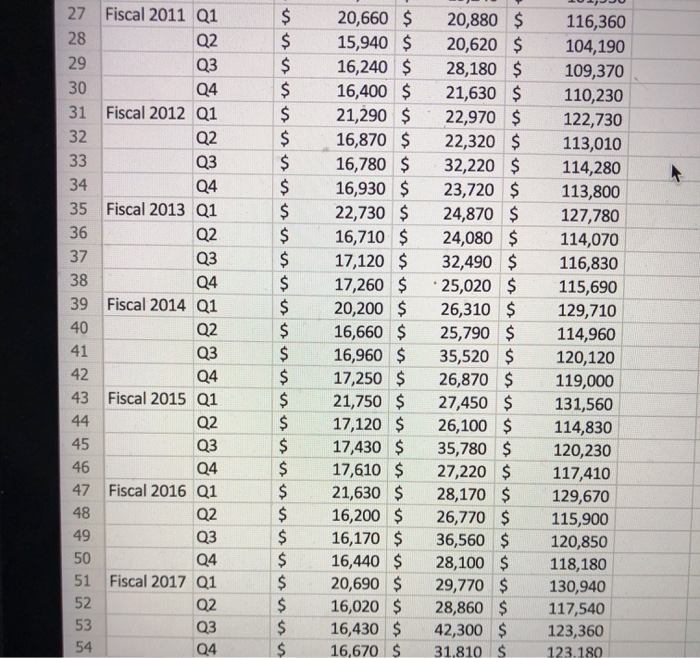
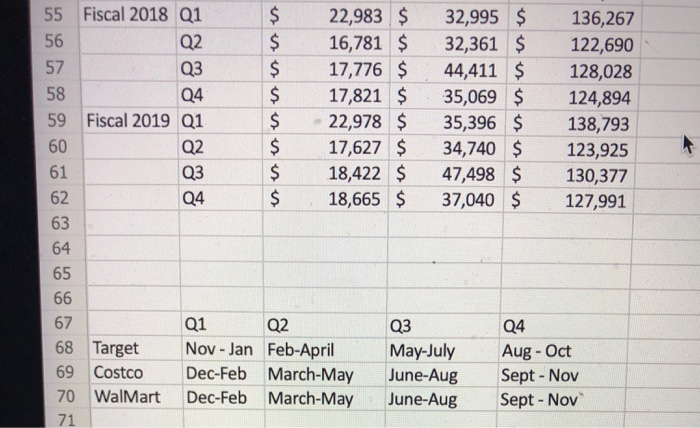
Case Study 2 Tom is the president of the Chamber of Commerce in Park Falls, Wisconsin. Tom would like to bring more retail in the area and is considering three companies: Wal-Mart, Costco and Target. He was able to locate some revenue data- found on the Excel sheet. Tom is interested in what all these data tell him. He has asked you to analyze the data for him and tell him what you discover. Compare and contrast the three companies. Questions to answer: Which company is growing at the fastest rate? Is there any evidence of any of the company's growth leveling off? Are seasonal fluctuations an issue in these sales figures? Which company is the most affected by seasonality? Predict revenue for each of the companies for 2020 and 2021. What recommendations do you have for Tom based on revenue? Instructions 1. Analyze the data 2. Draw your conclusions (should include next steps) 3. Create a PPT Presentation as if you were going to present your findings to Tom and some key business people in your area. a. This should be no more than 6 slides (a title slide and 5 content slides) b. Make sure your name is on it C. As you will not actually be presenting this I want you to write up what you would say for each slide in the Notes section d. PRINT your PowerPoint so that there is 1 slide with notes on each page (does not have to be in color) 4. Must be printed and turned in during class on the day it is due. A B C D E Quarterly Revenue Values in Millions of Dollars Target Costco Walmart Fiscal 2005 Q1 15,190 $ 12,660 $ 79,080 Q2 11,480 $ 12,000 $ 70,910 11,990 $ 16,720 $ 75,930 12,210 $ 12,930 $ 75,400 Fiscal 2006 16,950 $ 14,060 $ 89,250 12,860 $ 13,280 $ 79,680 13,350 $ 19,880 $ 84,520 13,570 $ 14,150 $ 84,470 Fiscal 2007 01 19,710 $ 15,110 $ 98,800 14,040 $ 14,660 $ 86,410 14,620 $ 21,480 $ 93,000 14,840 $ 15,810 $ 91,860 Fiscal 2008 Q1 19,870 $ 16,960 $ 107,340 14,800 $ 16,610 $ 94,940 15,470 $ 23,100 $ 102,340 15,110 $ 16,400 $ 98,340 Fiscal 2009 01 19,560 $ 16,840 $ 108,750 14,830 15,810 $ 94,240 15,070 $ 22,380 $ 100,880 15,280 $ 17,300 $ 99,370 Fiscal 2010 01 20,180 $ 18,740 $ 113,620 15,590 $ 17,780 $ 99,810 15,530 $ 24,120 $ 103,730 15,600 $ 19,240 $ 101,950 15 Fiscal 2011 01 Fiscal 2012 Q1 Fiscal 2013 Q1 Fiscal 2014 Q1 20,660 $ 15,940 $ 16,240 $ 16,400 $ 21,290 $ 16,870 $ 16,780 $ 16,930 $ 22,730 $ 16,710 $ 17,120 $ 17,260 $ 20,200 $ 16,660 $ 16,960 17,250 $ 21,750 $ 17,120 $ 17,430 $ 17,610 $ 21,630 $ 16,200 $ 16,170 $ 16,440 $ 20,690 $ 16,020 $ 16,430 $ 16,670 $ 20,880 $ 20,620 $ 28,180 $ 21,630 $ 22,970 $ 22,320 $ 32,220 $ 23,720 $ 24,870 $ 24,080 $ 32,490 $ 25,020 $ 26,310 $ 25,790 $ 35,520 $ 26,870 $ 27,450 $ 26,100 $ 35,780 $ 27,220 $ 28,170 $ 26,770 $ 36,560 $ 28,100 $ 29,770 $ 28,860 $ 42,300 $ 31.810 $ 116,360 104,190 109,370 110,230 122,730 113,010 114,280 113,800 127,780 114,070 116,830 115,690 129,710 114,960 120,120 119,000 131,560 114,830 120,230 117,410 129,670 115,900 120,850 118,180 130,940 117,540 123,360 123.180 Fiscal 2015 Q1 Fiscal 2016 Q1 Fiscal 2017 Fiscal 2018 Q1 22,983 $ 16,781 $ 17,776 $ 17,821 $ 22,978 $ 17,627 $ 18,422 $ 18,665 $ 32,995 $ 32,361 $ 44,411 $ 35,069 $ 35,396 $ 34,740 $ 47,498 $ 37,040 $ 136,267 122,690 128,028 124,894 138,793 123,925 130,377 127,991 Fiscal 2019 Q1 Q4 68 Target Costco Walmart Q1 Q2 Nov - Jan Feb-April Dec-Feb March-May Dec-Feb March-May Q3 May-July June-Aug June-Aug Aug - Oct Sept - Nov Sept - Nov Case Study 2 Tom is the president of the Chamber of Commerce in Park Falls, Wisconsin. Tom would like to bring more retail in the area and is considering three companies: Wal-Mart, Costco and Target. He was able to locate some revenue data- found on the Excel sheet. Tom is interested in what all these data tell him. He has asked you to analyze the data for him and tell him what you discover. Compare and contrast the three companies. Questions to answer: Which company is growing at the fastest rate? Is there any evidence of any of the company's growth leveling off? Are seasonal fluctuations an issue in these sales figures? Which company is the most affected by seasonality? Predict revenue for each of the companies for 2020 and 2021. What recommendations do you have for Tom based on revenue? Instructions 1. Analyze the data 2. Draw your conclusions (should include next steps) 3. Create a PPT Presentation as if you were going to present your findings to Tom and some key business people in your area. a. This should be no more than 6 slides (a title slide and 5 content slides) b. Make sure your name is on it C. As you will not actually be presenting this I want you to write up what you would say for each slide in the Notes section d. PRINT your PowerPoint so that there is 1 slide with notes on each page (does not have to be in color) 4. Must be printed and turned in during class on the day it is due. A B C D E Quarterly Revenue Values in Millions of Dollars Target Costco Walmart Fiscal 2005 Q1 15,190 $ 12,660 $ 79,080 Q2 11,480 $ 12,000 $ 70,910 11,990 $ 16,720 $ 75,930 12,210 $ 12,930 $ 75,400 Fiscal 2006 16,950 $ 14,060 $ 89,250 12,860 $ 13,280 $ 79,680 13,350 $ 19,880 $ 84,520 13,570 $ 14,150 $ 84,470 Fiscal 2007 01 19,710 $ 15,110 $ 98,800 14,040 $ 14,660 $ 86,410 14,620 $ 21,480 $ 93,000 14,840 $ 15,810 $ 91,860 Fiscal 2008 Q1 19,870 $ 16,960 $ 107,340 14,800 $ 16,610 $ 94,940 15,470 $ 23,100 $ 102,340 15,110 $ 16,400 $ 98,340 Fiscal 2009 01 19,560 $ 16,840 $ 108,750 14,830 15,810 $ 94,240 15,070 $ 22,380 $ 100,880 15,280 $ 17,300 $ 99,370 Fiscal 2010 01 20,180 $ 18,740 $ 113,620 15,590 $ 17,780 $ 99,810 15,530 $ 24,120 $ 103,730 15,600 $ 19,240 $ 101,950 15 Fiscal 2011 01 Fiscal 2012 Q1 Fiscal 2013 Q1 Fiscal 2014 Q1 20,660 $ 15,940 $ 16,240 $ 16,400 $ 21,290 $ 16,870 $ 16,780 $ 16,930 $ 22,730 $ 16,710 $ 17,120 $ 17,260 $ 20,200 $ 16,660 $ 16,960 17,250 $ 21,750 $ 17,120 $ 17,430 $ 17,610 $ 21,630 $ 16,200 $ 16,170 $ 16,440 $ 20,690 $ 16,020 $ 16,430 $ 16,670 $ 20,880 $ 20,620 $ 28,180 $ 21,630 $ 22,970 $ 22,320 $ 32,220 $ 23,720 $ 24,870 $ 24,080 $ 32,490 $ 25,020 $ 26,310 $ 25,790 $ 35,520 $ 26,870 $ 27,450 $ 26,100 $ 35,780 $ 27,220 $ 28,170 $ 26,770 $ 36,560 $ 28,100 $ 29,770 $ 28,860 $ 42,300 $ 31.810 $ 116,360 104,190 109,370 110,230 122,730 113,010 114,280 113,800 127,780 114,070 116,830 115,690 129,710 114,960 120,120 119,000 131,560 114,830 120,230 117,410 129,670 115,900 120,850 118,180 130,940 117,540 123,360 123.180 Fiscal 2015 Q1 Fiscal 2016 Q1 Fiscal 2017 Fiscal 2018 Q1 22,983 $ 16,781 $ 17,776 $ 17,821 $ 22,978 $ 17,627 $ 18,422 $ 18,665 $ 32,995 $ 32,361 $ 44,411 $ 35,069 $ 35,396 $ 34,740 $ 47,498 $ 37,040 $ 136,267 122,690 128,028 124,894 138,793 123,925 130,377 127,991 Fiscal 2019 Q1 Q4 68 Target Costco Walmart Q1 Q2 Nov - Jan Feb-April Dec-Feb March-May Dec-Feb March-May Q3 May-July June-Aug June-Aug Aug - Oct Sept - Nov Sept - Nov
