

Question
Case Study #3 is intended to test your knowledge of how to appropriately compare two means. The data file has 50 randomly selected student debt
Case Study #3 is intended to test your knowledge of how to appropriately compare two means.
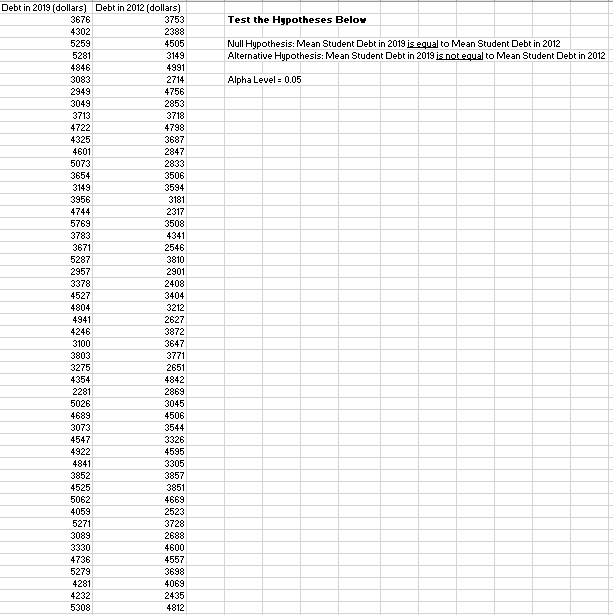
The data file has 50 randomly selected student debt amounts from 2019 and 50 randomly
selected student debt amounts from 2012. The data fields included are as follows:
? Debt in 2019 (dollars)
? Debt in 2012 (dollars)
A university representative wants to know whether the sample data provide enough evidence
to believe there is a difference between the debt amounts in the two years. The null and
alternative hypotheses are shown below.
? Null Hypothesis: Mean Student Debt in 2019 is equal to Mean Student Debt in 2012
? Alternative Hypothesis: Mean Student Debt in 2019 is not equal to Mean Student Debt
in 2012
Complete the following tasks:
1. Run an F-test for two sample variances using an alpha level of 0.05 and answer the
following questions:
a. Which of the two years has the higher mean? What are the values?
b. Which of the two years has the higher variance? What are the values?
c. Based on the statistical output, would you conclude that variances are equal or
not equal? Provide an appropriate/authoritative explanation leveraging the
statistical output.
2. Run an appropriate t-test (assuming either equal or unequal variances based on your
conclusion in 1c above) using an alpha level of 0.05 and answer the following questions:
a. Is this a one-tailed or two-tailed test? Provide an appropriate/authoritative
explanation that fully explains the choice.
b. Based on the statistical output, would you conclude that means are equal or not
equal? Provide an appropriate/authoritative explanation leveraging the
statistical output.
c. Using everyday language that could be understood by parents and students,
what does the analysis say about student debt in 2019 versus 2012? Provide an
appropriate/authoritative explanation leveraging the statistical output (e.g., use
confidence level, rationale, etc.)
Make sure that you run all the required analyses using the Data Analysis Toolpak in Excel and
SUBMIT the Data Analysis Output along with the Data file in a Single Excel workbook that
shows all your output. You should also submit a separate Word document that fully, and
professionally, responds to each question.
Step by Step Solution
There are 3 Steps involved in it
Step: 1

Get Instant Access to Expert-Tailored Solutions
See step-by-step solutions with expert insights and AI powered tools for academic success
Step: 2

Step: 3
Ace Your Homework with AI
Get the answers you need in no time with our AI-driven, step-by-step assistance
Get Started
Theory And Applications Of Partial Functional Differential Equations
Authors: Abrar A Khan
1st Edition
9353141915, 9789353141912