

The data represent the cost, return on investment, and graduation rate for a random sample of fifty colleges or universities in the United States. The
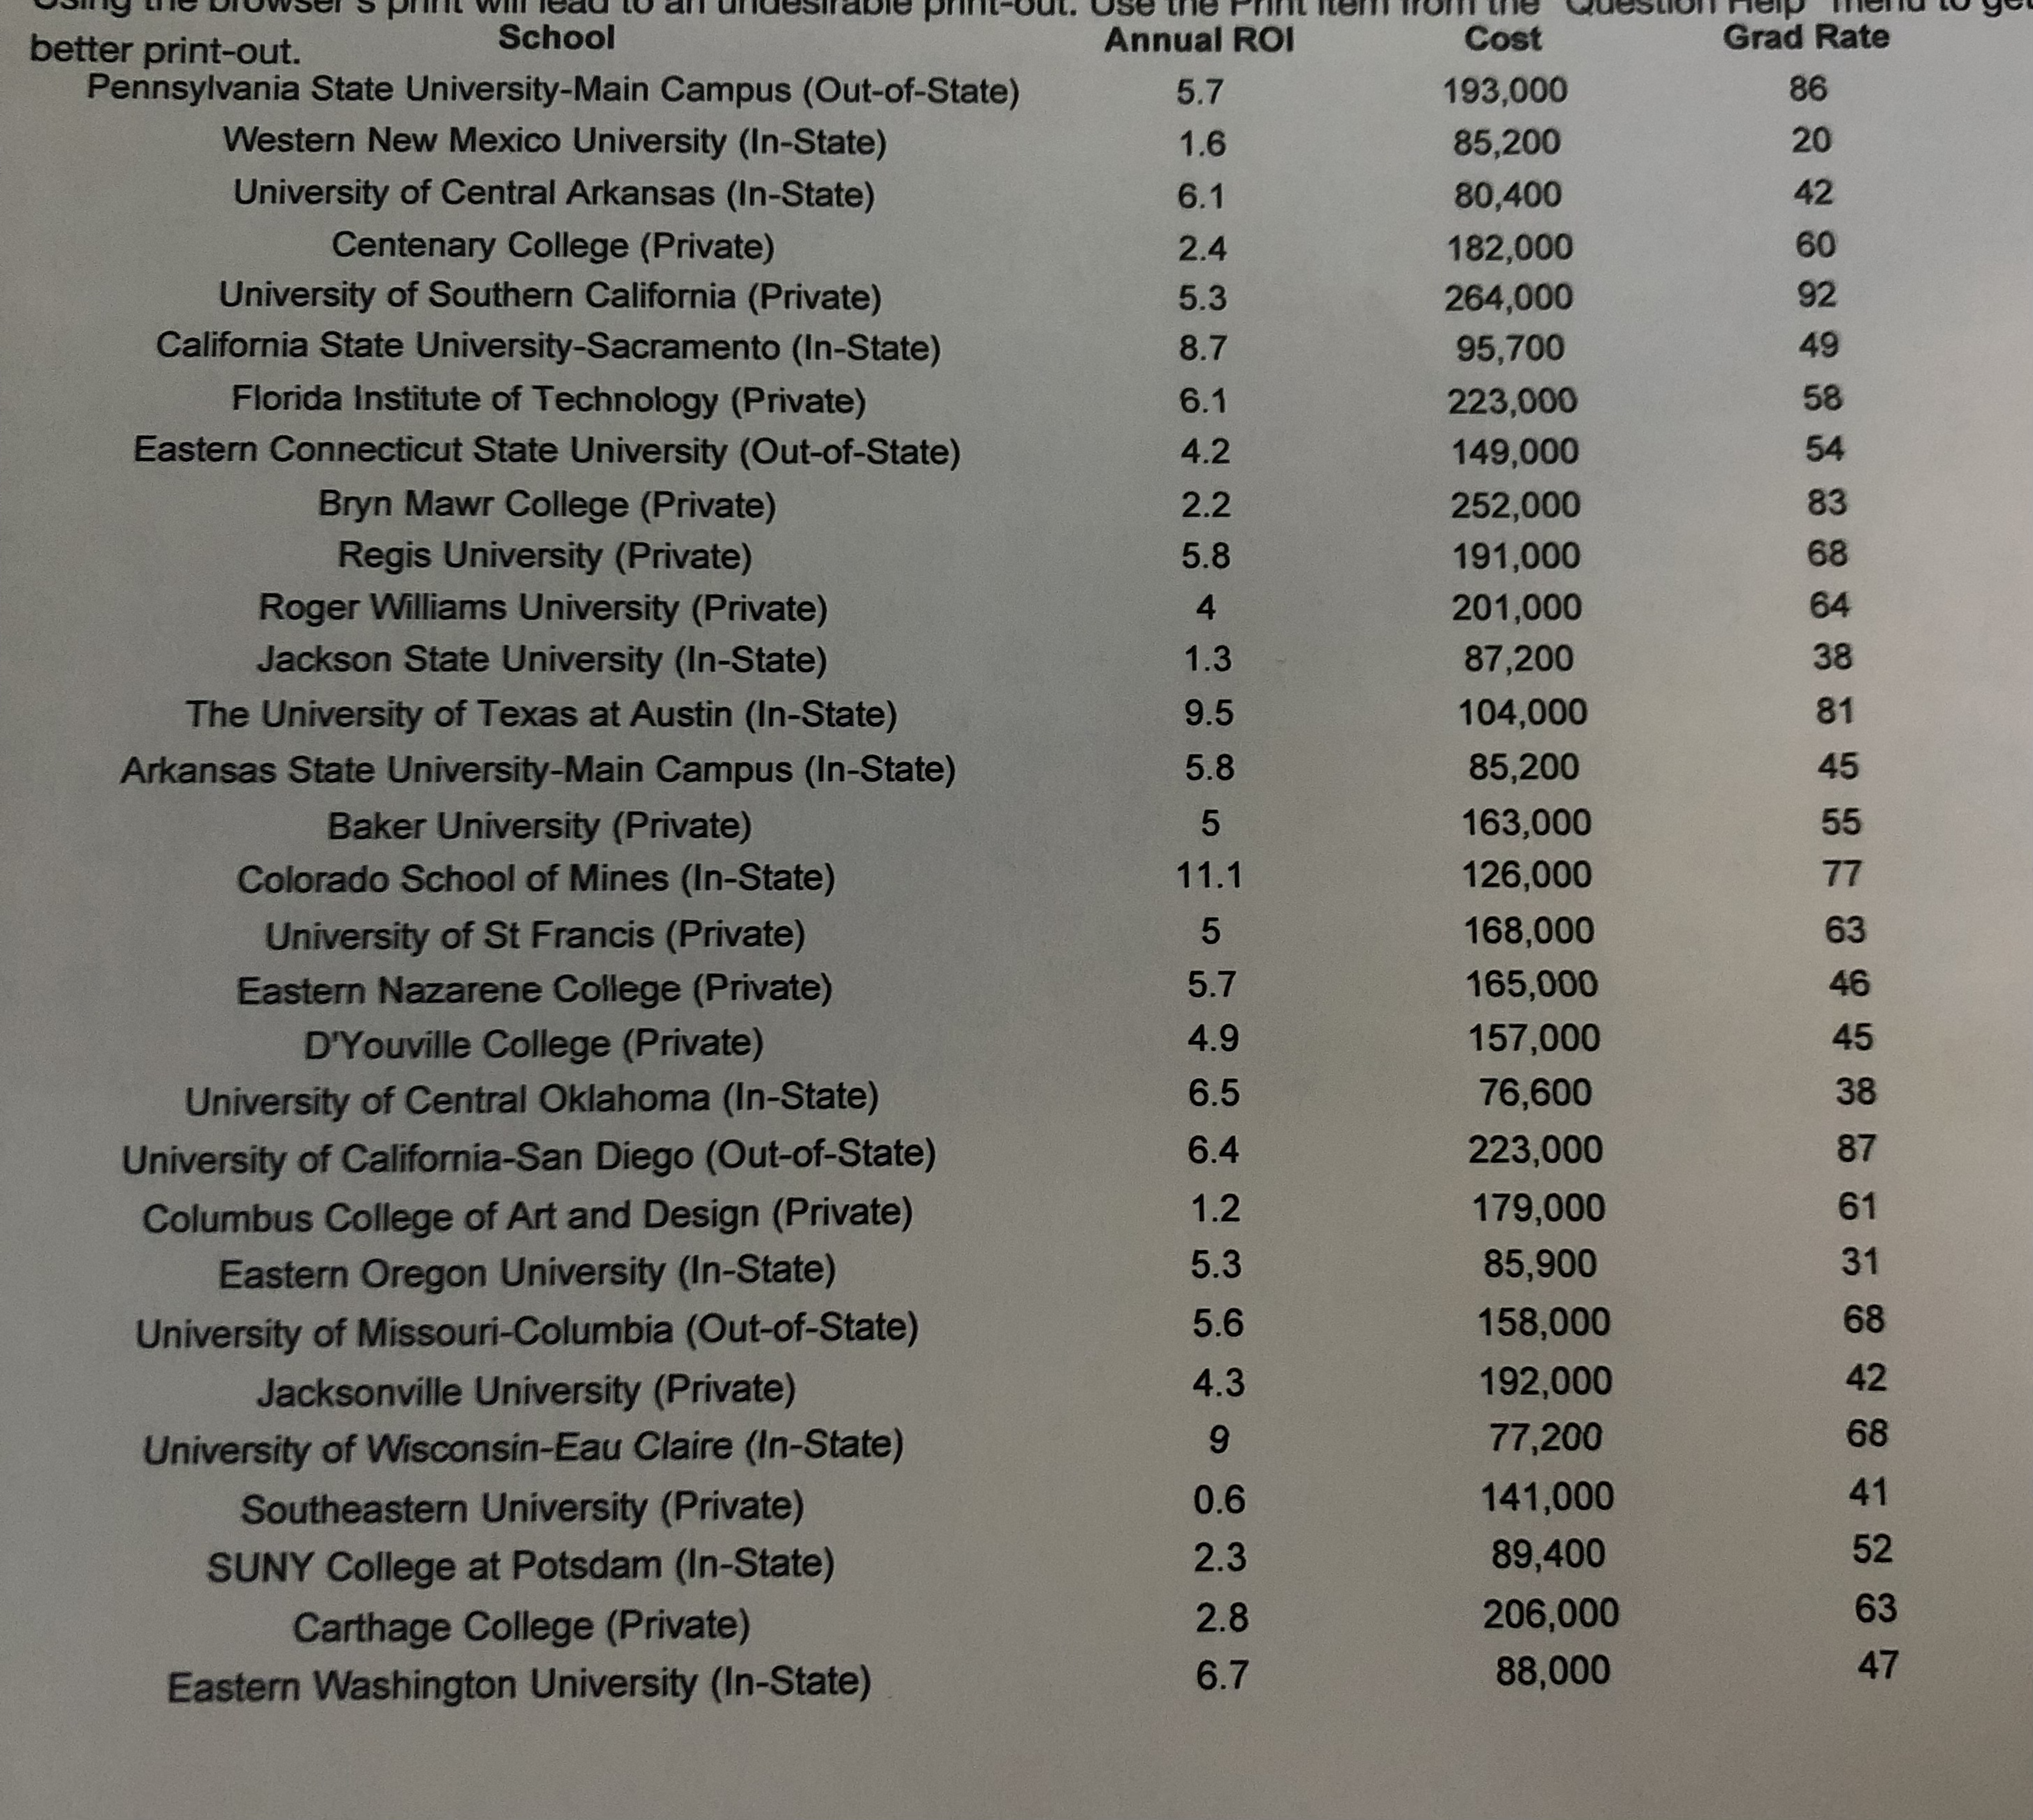
The data represent the cost, return on investment, and graduation rate for a random sample of fifty colleges or universities in the United States. The data is from payscale.com. The variable "Cost" represents the four-year cost including tuition, supplies, room and board of attending the school. The variable "Annual ROI" represents the return on investment for graduates of the school. It essentially represents how much you would earn on the investment of attending the school. The variable "Grad Rate" represents the graduation rate of the school. Complete parts (a) through (f).
Part 1
(a
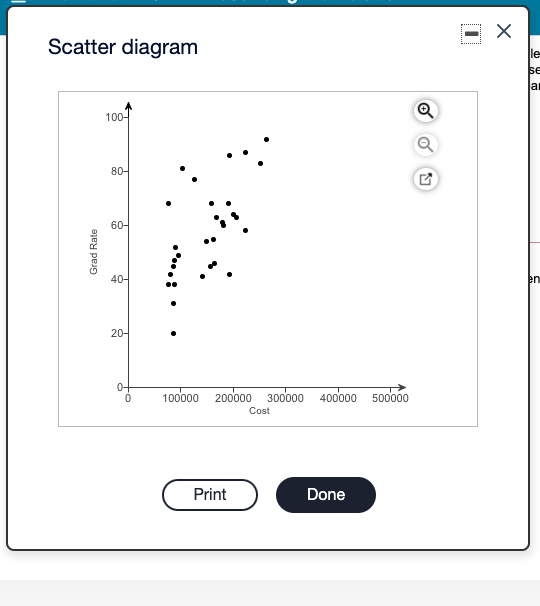
between Cost and Grad Rate suggests a positive association between the two variables. Find the least-squares regression line treating Cost as the explanatory variable.
y=( )x+( )
(Round the slope to six decimal places. Round the constant to three decimal places.)

Step by Step Solution
There are 3 Steps involved in it
Step: 1
Heres the leastsquares regression line treating Cost as ... View full answer

Get step-by-step solutions from verified subject matter experts
100% Satisfaction Guaranteed-or Get a Refund!
Step: 2Unlock detailed examples and clear explanations to master concepts

Step: 3Unlock to practice, ask and learn with real-world examples
See step-by-step solutions with expert insights and AI powered tools for academic success
-
 Access 30 Million+ textbook solutions.
-
Ask unlimited questions from AI Tutors.
-
Order free textbooks.
-
100% Satisfaction Guaranteed-or Get a Refund!
Claim Your Hoodie Now!

Authors: De Jun Feng, Ka Sing Lau
1st Edition
3662439204, 9783662439203

Study Smart with AI Flashcards
Access a vast library of flashcards, create your own, and experience a game-changing transformation in how you learn and retain knowledge
Explore Flashcards

