

Question: CASE STUDY CASE STUDY ANALYSIS OF HASBRO, INC. The management of Hasbro, Inc. has approached your company concerning the operations of their business. Recognizing the
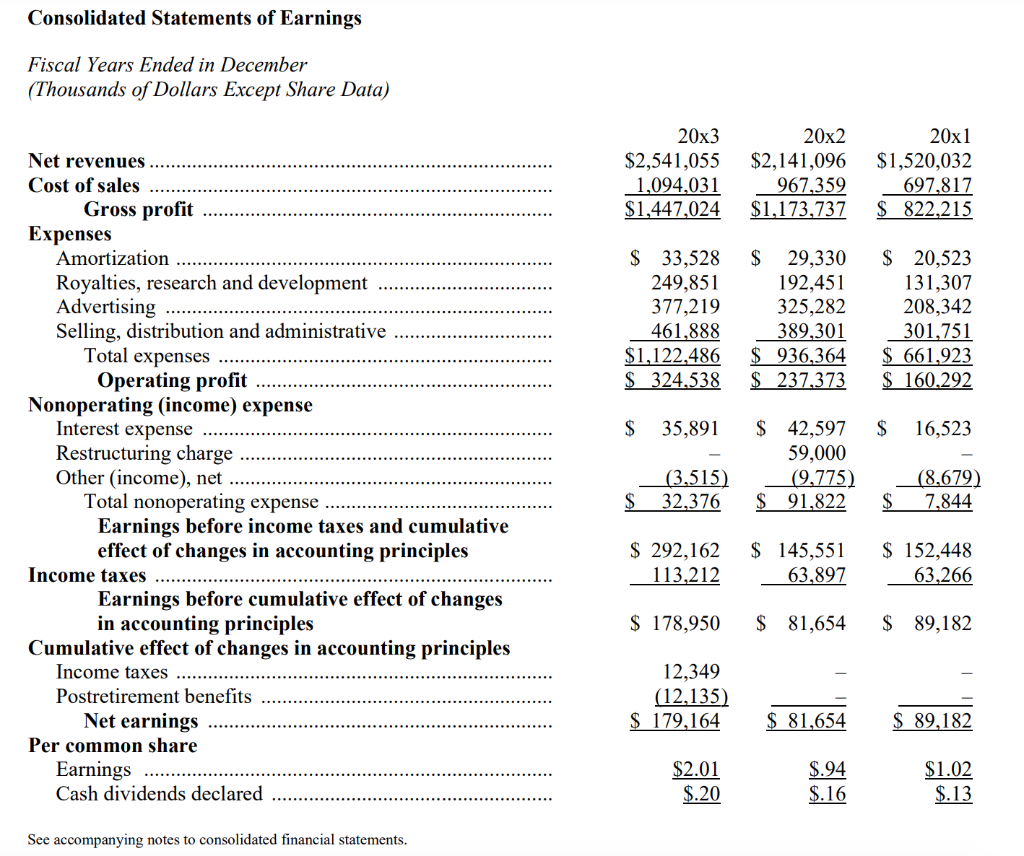
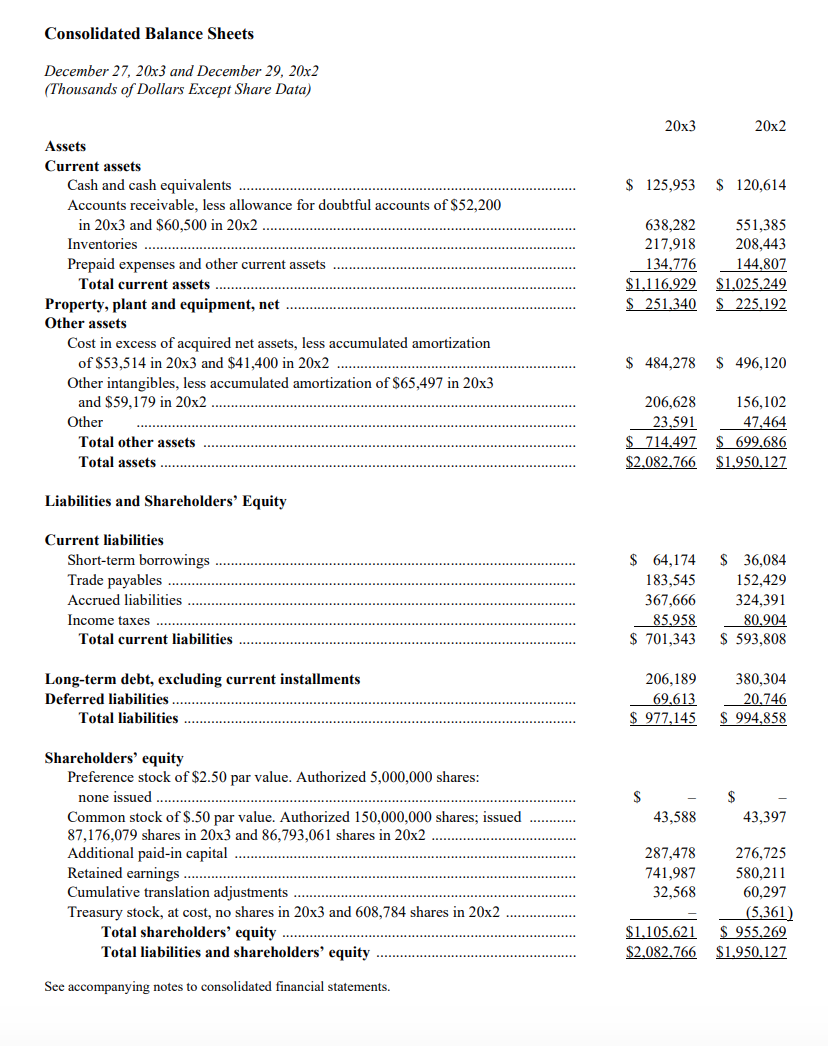
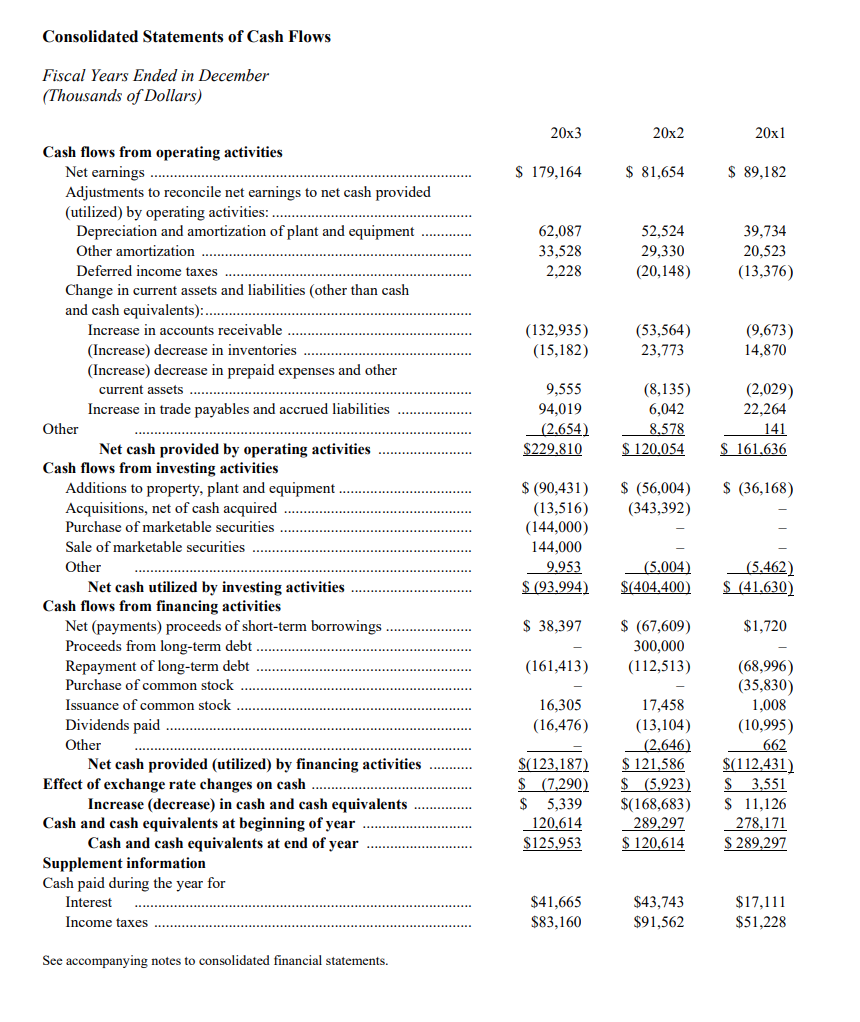
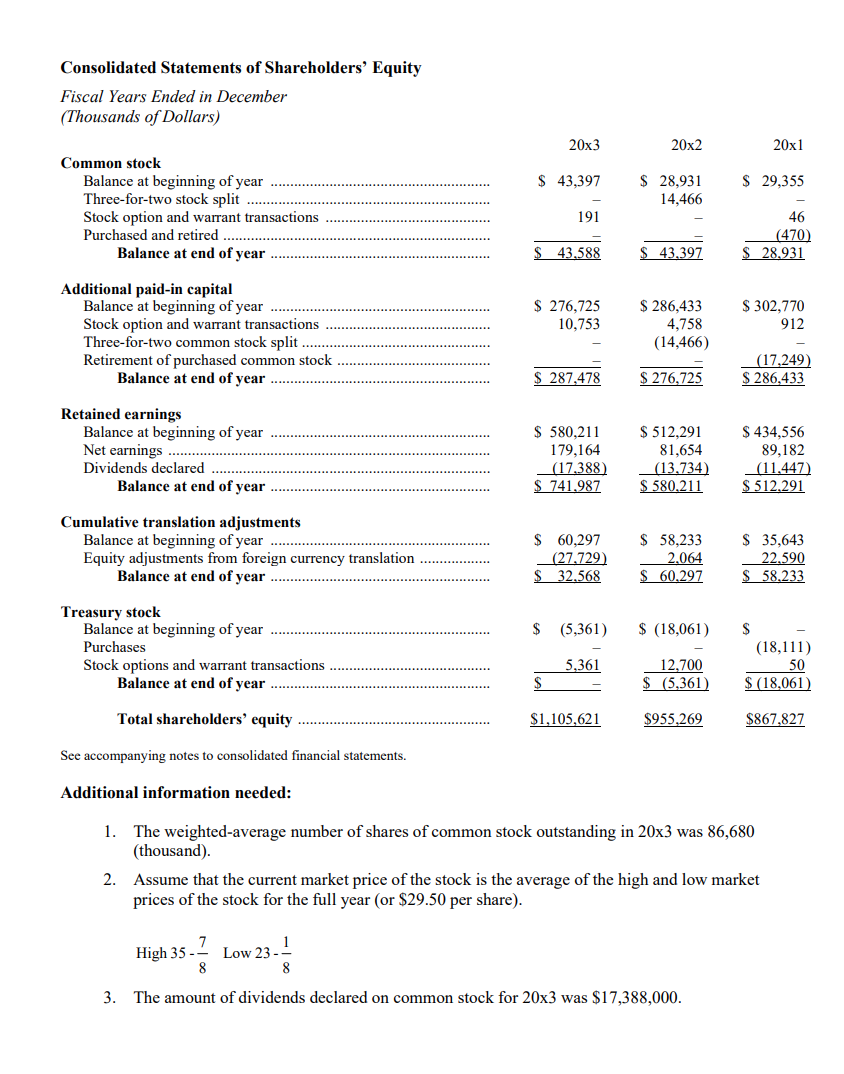
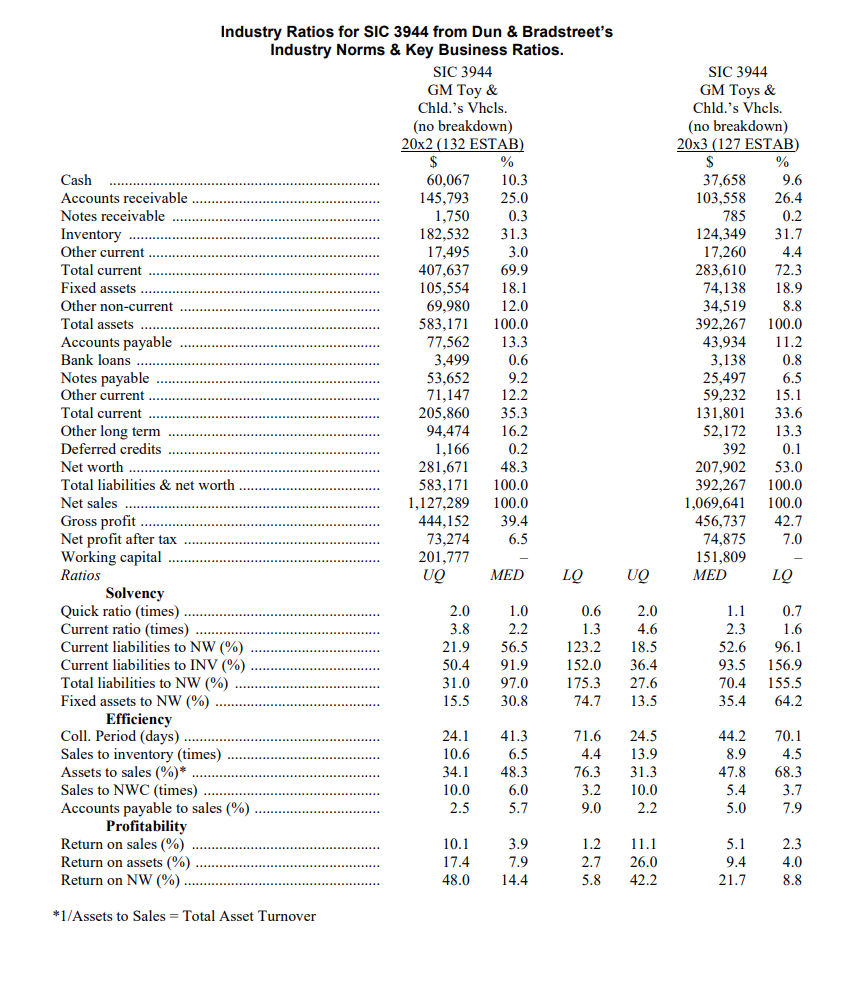
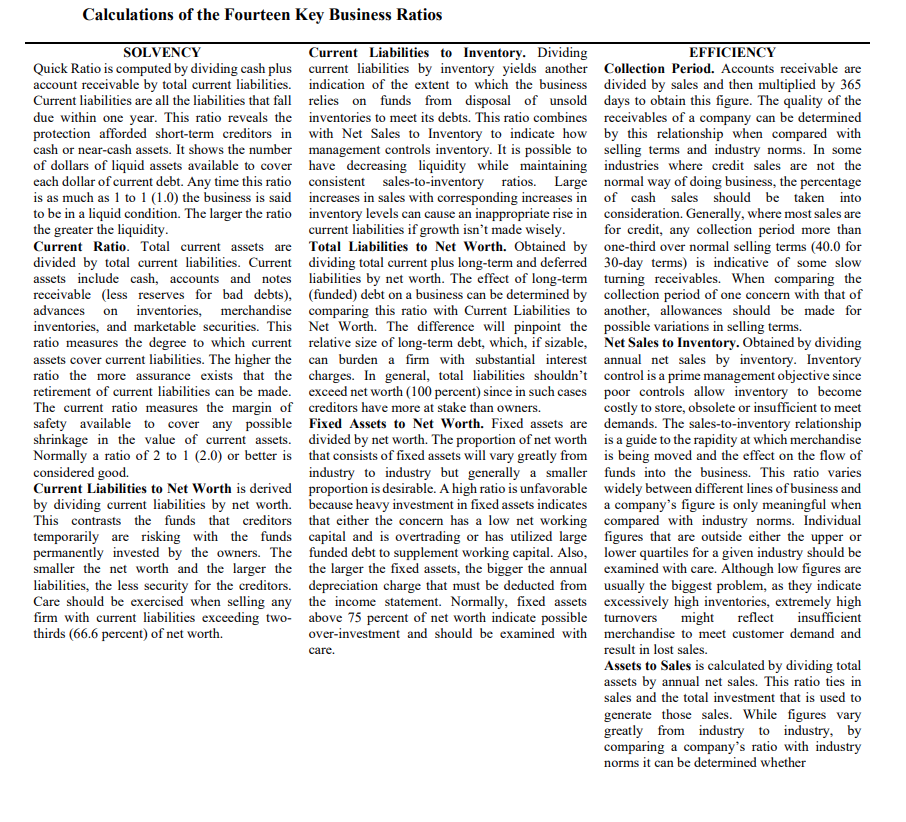
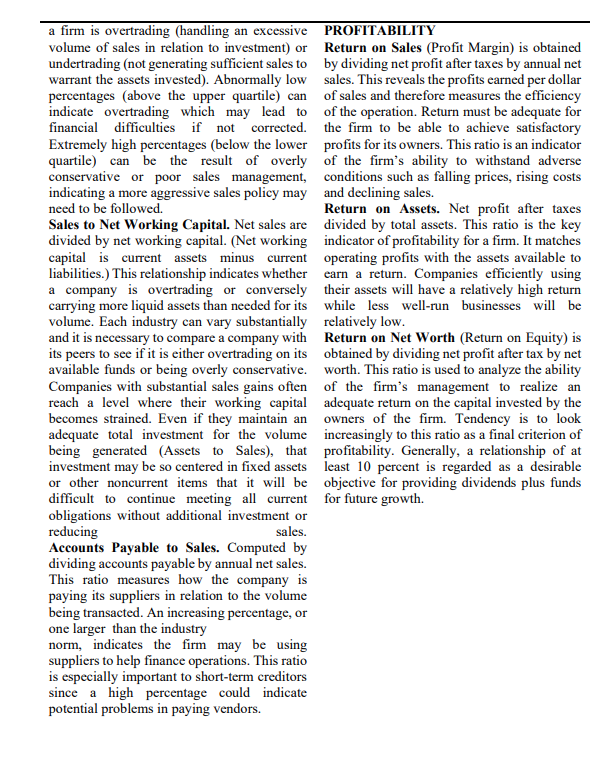
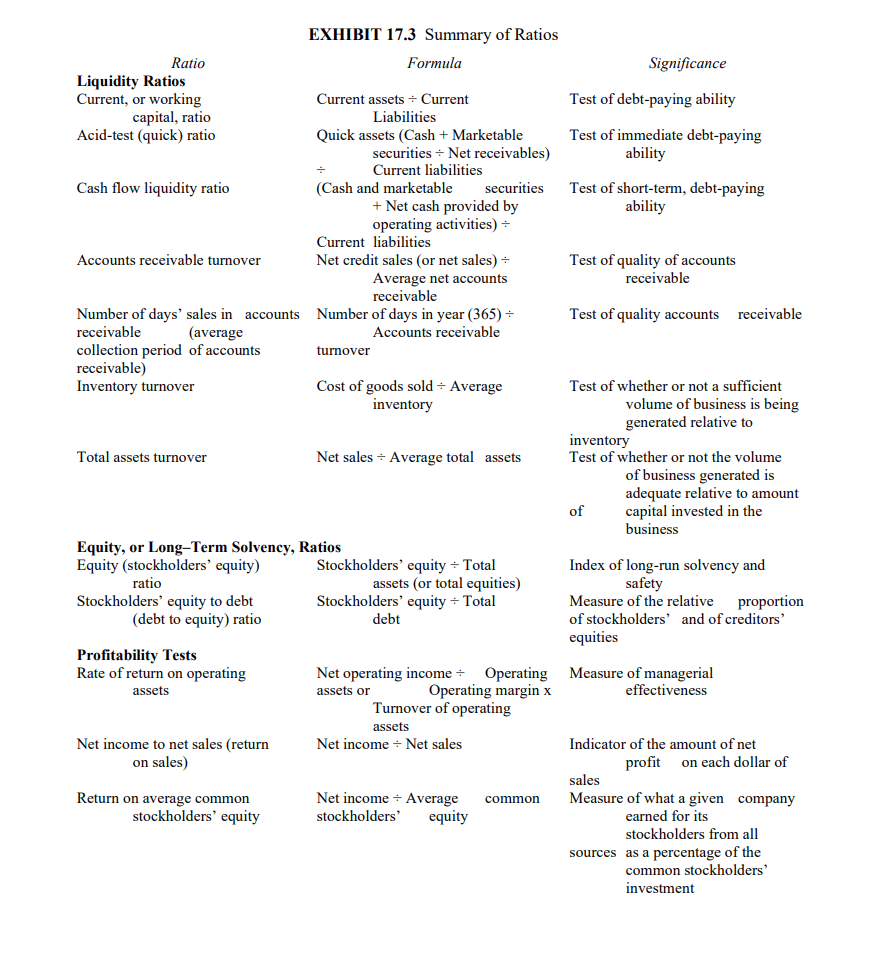
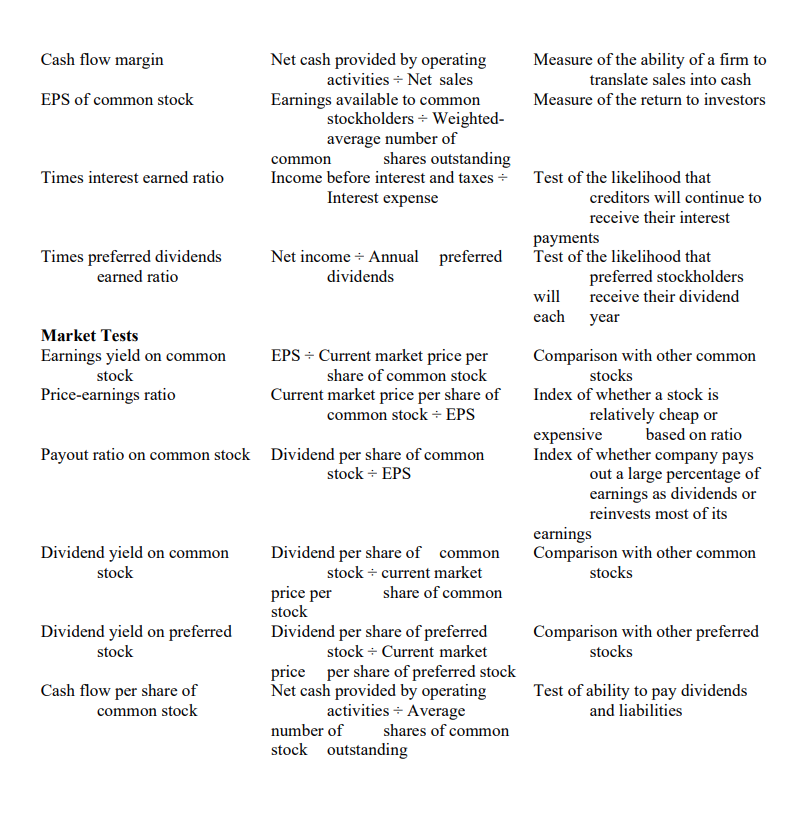
CASE STUDY CASE STUDY ANALYSIS OF HASBRO, INC. The management of Hasbro, Inc. has approached your company concerning the operations of their business. Recognizing the importance of analyzing past results to determine if problems have arisen, the management of Hasbro, Inc. has requested that your company analyze their performance for the year ended December 27, 20x3. They have requested that your company provide for them a memo outlining the results of your study. 1. You should calculate all the ratios listed in Exhibit 17.3 for the year ended December 27, 20x3. Comment on your calculations. 2. Compare these ratios and percentages with the industry numbers provided from Dun & Bradstreet's Industry Norms & Key Business Ratios. Comment on Hasbro's position within the industry. 3. Perform a vertical analysis of Hasbro's balance sheet for 20x3 and 20x2. Comment on your results. Profile Hasbro, Inc., together with its subsidiaries, provides children's and family leisure time products and services worldwide. Its product offerings encompass various toys, including boys action figures, vehicles and play sets, girls toys, electronic toys, plush products, preschool toys and infant products, electronic interactive products, and creative play and toy-related specialty products; and games comprising action, board, card, electronic, trading card, and role-playing games. The company offers its products primarily under various brands, including TRANSFORMERS, NERF, LITTLEST PET SHOP, MY LITTLE PONY, BABY ALIVE, G.I. JOE, MONOPOLY, MAGIC: THE GATHERING, PLAY-DOH, and PLAYSKOOL. It also licenses its trademarks, characters, and other property rights to third parties for use in connection with digital gaming, consumer promotions, as well as for sale of non-competing toys and games, and non-toy products. Hasbro, Inc. was founded in 1923 and is headquartered in Pawtucket, Rhode Island. Consolidated Statements of Earnings Fiscal Years Ended in December (Thousands of Dollars Except Share Data) 20x3 $2,541,055 1,094,031 $1,447,024 20x2 $2,141,096 967,359 $1,173,737 20x1 $1,520,032 6 97,817 $ 822,215 194 $ 33,528 249,851 377,219 461.888 $1,122.486 $ 324,538 $ 29,330 192,451 325,282 389,301 $ 936,364 $ 237,373 $ 20,523 131,307 208,342 301.751 $ 661,923 $ 160,292 $ 35,891 $ 16,523 Net revenues .............................. ....... Cost of sales ............ Gross profit Expenses Amortization ..... Royalties, research and development ... Advertising ........ Selling, distribution and administrative ... Total expenses Operating profit .................. Nonoperating (income) expense Interest expense ............ Restructuring charge ....... Other (income), net ......... Total nonoperating expense ..... Earnings before income taxes and cumulative effect of changes in accounting principles Income taxes ......... Earnings before cumulative effect of changes in accounting principles Cumulative effect of changes in accounting principles Income taxes ............ Postretirement benefits ........... Net earnings Per common share Earnings ......... Cash dividends declared $ 42,597 59.000 (9,775) $ 91,822 (3,515) 32,376 (8,679) 7,844 $ $ $ 292,162 113,212 $ 145,551 63,897 $ 152,448 63.266 $ 178,950 $ 81,654 $ 89,182 12,349 (12,135) $ 179,164 $ 81,654 $ 89,182 $2.01 $.20 $.94 $.16 $1.02 $.13 See accompanying notes to consolidated financial statements. Consolidated Balance Sheets December 27, 20x3 and December 29, 20x2 (Thousands of Dollars Except Share Data) 20x3 20x2 $ 125,953 $ 120,614 Assets Current assets Cash and cash equivalents .... Accounts receivable, less allowance for doubtful accounts of $52,200 in 20x3 and $60,500 in 20x2 .. Inventories Prepaid expenses and other current assets ......... Total current assets Property, plant and equipment, net .............. Other assets Cost in excess of acquired net assets, less accumulated amortization of $53,514 in 20x3 and $41,400 in 20x2 ....... Other intangibles, less accumulated amortization of $65,497 in 20x3 and $59,179 in 20x2 Other Total other assets Total assets. 638,282 217,918 134,776 $1.116.929 $ 251,340 551,385 208,443 144,807 $1,025,249 $225,192 $ 484,278 $ 496,120 206,628 23,591 $ 714.497 $2.082.766 156,102 47,464 $ 699.686 $1.950,127 Liabilities and Shareholders' Equity Current liabilities Short-term borrowings ...... Trade payables Accrued liabilities .......... Income taxes ... Total current liabilities. $ 64,174 183,545 367,666 85,958 $ 701,343 $ 36,084 152,429 324,391 80,904 $ 593,808 Long-term debt, excluding current installments Deferred liabilities. Total liabilities ....... 206,189 69,613 $ 977,145 380,304 20,746 $ 994,858 $ $ - 43,588 43,397 Shareholders' equity Preference stock of $2.50 par value. Authorized 5,000,000 shares: none issued .. Common stock of $.50 par value. Authorized 150,000,000 shares; issued ............ 87,176,079 shares in 20x3 and 86,793,061 shares in 20x2 Additional paid-in capital Retained earnings ... Cumulative translation adjustments Treasury stock, at cost, no shares in 20x3 and 608,784 shares in 20x2 .............. Total shareholders' equity Total liabilities and shareholders' equity .......... .......... 287,478 741,987 32,568 276,725 580,211 60,297 (5,361) $ 955,269 $1,950,127 $1,105,621 $2,082,766 See accompanying notes to consolidated financial statements. Consolidated Statements of Cash Flows Fiscal Years Ended in December (Thousands of Dollars) 20x3 20x2 20x1 $ 179,164 $ 81,654 $ 89,182 62,087 33,528 2,228 52,524 29,330 (20,148) 39,734 20,523 (13,376) (132,935) (15,182) (53,564) 23,773 (9,673) 14,870 (2,029) 22,264 9,555 94,019 (2.654) $229,810 (8,135) 6,042 8,578 $ 120,054 141 $ 161,636 $ (36,168) $ (56,004) (343,392) Cash flows from operating activities Net earnings ....... Adjustments to reconcile net earnings to net cash provided (utilized) by operating activities: .. Depreciation and amortization of plant and equipment ............. Other amortization ............ Deferred income taxes ........ Change in current assets and liabilities (other than cash and cash equivalents): ............... Increase in accounts receivable ................. (Increase) decrease in inventories (Increase) decrease in prepaid expenses and other current assets Increase in trade payables and accrued liabilities ........... Other Net cash provided by operating activities Cash flows from investing activities Additions to property, plant and equipment Acquisitions, net of cash acquired Purchase of marketable securities ........ Sale of marketable securities Other Net cash utilized by investing activities Cash flows from financing activities Net (payments) proceeds of short-term borrowings ........ Proceeds from long-term debt Repayment of long-term debt .... Purchase of common stock Issuance of common stock ... Dividends paid Other Net cash provided (utilized) by financing activities Effect of exchange rate changes on cash ...... Increase (decrease) in cash and cash equivalents ...... Cash and cash equivalents at beginning of year .. Cash and cash equivalents at end of year Supplement information Cash paid during the year for Interest Income taxes ................ $ (90,431) (13,516) (144,000) 144,000 9.953 $ (93,994) ......... (5,004) $(404,400) (5.462) $ (41,630) $ 38,397 $1,720 $ (67,609) 300,000 (112,513) (161,413) 16,305 (16,476) ......... 17,458 (13,104) (2,646) $ 121,586 $ (5,923) $(168,683) 289,297 $ 120,614 $(123,187) $ (7,290) $ 5,339 120,614 $125,953 (68,996) (35,830) 1,008 (10,995) 662 $(112,431) $ 3,551 $ 11,126 278,171 $ 289,297 ......... $41,665 $83,160 $43,743 $91,562 $17,111 $51,228 See accompanying notes to consolidated financial statements. Consolidated Statements of Shareholders' Equity Fiscal Years Ended in December (Thousands of Dollars) 20x3 20x2 20x1 $ 43,397 $ 29,355 $ 28,931 14,466 Common stock Balance at beginning of year Three-for-two stock split ....... Stock option and warrant transactions ........ Purchased and retired ... Balance at end of year 191 46 (470) $ 28,931 $ 43.588 $ 43,397 $ 276,725 10,753 Additional paid-in capital Balance at beginning of year ............ Stock option and warrant transactions Three-for-two common stock split ..... Retirement of purchased common stock Balance at end of year .. $ 286,433 4,758 (14,466) $ 302,770 912 $ 287,478 $ 276,725 (17.249) S 286,433 Retained earnings Balance at beginning of year ..... Net earnings ......... Dividends declared ... Balance at end of year ....... $512,291 81,654 $ 580,211 179,164 (17.388) $ 741,987 $ 434,556 89,182 (11.447) S 512.291 $ 580,211 Cumulative translation adjustments Balance at beginning of year Equity adjustments from foreign currency translation Balance at end of year ... $ 60.297 _(27.729) $ 32.568 $ 58,233 2.064 $ 60,297 $ 35,643 22.590 $ 58.233 $ (5,361) $ (18,061) $ Treasury stock Balance at beginning of year Purchases Stock options and warrant transactions ...... Balance at end of year ................. (18,111) 5,361 SO 12,700 $ (5,361) $ (18,061) Total shareholders' equity .......... $1,105,621 $955,269 $867,827 See accompanying notes to consolidated financial statements. Additional information needed: 1. The weighted-average number of shares of common stock outstanding in 20x3 was 86,680 (thousand). 2. Assume that the current market price of the stock is the average of the high and low market prices of the stock for the full year (or $29.50 per share). High 35 -? Low 23. 3. The amount of dividends declared on common stock for 20x3 was $17,388,000. Calculations of the Fourteen Key Business Ratios SOLVENCY Current Liabilities to Inventory. Dividing EFFICIENCY Quick Ratio is computed by dividing cash plus current liabilities by inventory yields another Collection Period. Accounts receivable are account receivable by total current liabilities. indication of the extent to which the business divided by sales and then multiplied by 365 Current liabilities are all the liabilities that fall relies on funds from disposal of unsold days to obtain this figure. The quality of the due within one year. This ratio reveals the inventories to meet its debts. This ratio combines receivables of a company can be determined protection afforded short-term creditors in with Net Sales to Inventory to indicate how by this relationship when compared with cash or near-cash assets. It shows the number management controls inventory. It is possible to selling terms and industry norms. In some of dollars of liquid assets available to cover have decreasing liquidity while maintaining industries where credit sales are not the each dollar of current debt. Any time this ratio consistent sales-to-inventory ratios. Large normal way of doing business, the percentage is as much as 1 to 1 (1.0) the business is said increases in sales with corresponding increases in of cash sales should be taken into to be in a liquid condition. The larger the ratio inventory levels can cause an inappropriate rise in consideration. Generally, where most sales are the greater the liquidity. current liabilities if growth isn't made wisely. for credit, any collection period more than Current Ratio. Total current assets are Total Liabilities to Net Worth. Obtained by one-third over normal selling terms (40.0 for divided by total current liabilities. Current dividing total current plus long-term and deferred 30-day terms) is indicative of some slow assets include cash, accounts and notes liabilities by net worth. The effect of long-term turning receivables. When comparing the receivable (less reserves for bad debts), (funded) debt on a business can be determined by collection period of one concern with that of advances on inventories, merchandise comparing this ratio with Current Liabilities to another, allowances should be made for inventories, and marketable securities. This Net Worth. The difference will pinpoint the possible variations in selling terms. ratio measures the degree to which current relative size of long-term debt, which, if sizable, Net Sales to Inventory. Obtained by dividing assets cover current liabilities. The higher the can burden a firm with substantial interest annual net sales by inventory. Inventory ratio the more assurance exists that the charges. In general, total liabilities shouldn't control is a prime management objective since retirement of current liabilities can be made. exceed net worth (100 percent) since in such cases poor controls allow inventory to become The current ratio measures the margin of creditors have more at stake than owners. costly to store, obsolete or insufficient to meet safety available to cover any possible Fixed Assets to Net Worth. Fixed assets are demands. The sales-to-inventory relationship shrinkage in the value of current assets. divided by net worth. The proportion of net worth is a guide to the rapidity at which merchandise Normally a ratio of 2 to 1 (2.0) or better is that consists of fixed assets will vary greatly from is being moved and the effect on the flow of considered good. industry to industry but generally a smaller funds into the business. This ratio varies Current Liabilities to Net Worth is derived proportion is desirable. A high ratio is unfavorable widely between different lines of business and by dividing current liabilities by net worth. because heavy investment in fixed assets indicates a company's figure is only meaningful when This contrasts the funds that creditors that either the concern has a low net working compared with industry norms. Individual temporarily are risking with the funds capital and is overtrading or has utilized large figures that are outside either the upper or permanently invested by the owners. The funded debt to supplement working capital. Also, lower quartiles for a given industry should be smaller the net worth and the larger the the larger the fixed assets, the bigger the annual examined with care. Although low figures are liabilities, the less security for the creditors. depreciation charge that must be deducted from usually the biggest problem, as they indicate Care should be exercised when selling any the income statement. Normally, fixed assets excessively high inventories, extremely high firm with current liabilities exceeding two- above 75 percent of net worth indicate possible turnovers might reflect insufficient thirds (66.6 percent) of net worth. over-investment and should be examined with merchandise to meet customer demand and care. result in lost sales. Assets to Sales is calculated by dividing total assets by annual net sales. This ratio ties in sales and the total investment that is used to generate those sales. While figures vary greatly from industry to industry, by comparing a company's ratio with industry norms it can be determined whether a firm is overtrading (handling an excessive PROFITABILITY volume of sales in relation to investment) or Return on Sales (Profit Margin) is obtained undertrading (not generating sufficient sales to by dividing net profit after taxes by annual net warrant the assets invested). Abnormally low sales. This reveals the profits earned per dollar percentages (above the upper quartile) can of sales and therefore measures the efficiency indicate overtrading which may lead to of the operation. Return must be adequate for financial difficulties if not corrected the firm to be able to achieve satisfactory Extremely high percentages (below the lower profits for its owners. This ratio is an indicator quartile) can be the result of overly of the firm's ability to withstand adverse conservative or poor sales management, conditions such as falling prices, rising costs indicating a more aggressive sales policy may and declining sales. need to be followed. Return on Assets. Net profit after taxes Sales to Net Working Capital. Net sales are divided by total assets. This ratio is the key divided by net working capital. (Net working indicator of profitability for a firm. It matches capital is current assets minus current operating profits with the assets available to liabilities.) This relationship indicates whether earn a return. Companies efficiently using a company is overtrading or conversely their assets will have a relatively high return carrying more liquid assets than needed for its while less well-run businesses will be volume. Each industry can vary substantially relatively low. and it is necessary to compare a company with Return on Net Worth (Return on Equity) is its peers to see if it is either overtrading on its obtained by dividing net profit after tax by net available funds or being overly conservative. worth. This ratio is used to analyze the ability Companies with substantial sales gains often of the firm's management to realize an reach a level where their working capital adequate return on the capital invested by the becomes strained. Even if they maintain an owners of the firm. Tendency is to look adequate total investment for the volume increasingly to this ratio as a final criterion of being generated (Assets to Sales), that profitability. Generally, a relationship of at investment may be so centered in fixed assets least 10 percent is regarded as a desirable or other noncurrent items that it will be objective for providing dividends plus funds difficult to continue meeting all current for future growth. obligations without additional investment or reducing sales. Accounts Payable to Sales. Computed by dividing accounts payable by annual net sales. This ratio measures how the company is paying its suppliers in relation to the volume being transacted. An increasing percentage, or one larger than the industry norm, indicates the firm may be using suppliers to help finance operations. This ratio is especially important to short-term creditors since a high percentage could indicate potential problems in paying vendors. Significance Test of debt-paying ability Test of immediate debt-paying ability Test of short-term, debt-paying ability EXHIBIT 17.3 Summary of Ratios Ratio Formula Liquidity Ratios Current, or working Current assets Current capital, ratio Liabilities Acid-test (quick) ratio Quick assets (Cash + Marketable securities - Net receivables) Current liabilities Cash flow liquidity ratio (Cash and marketable securities + Net cash provided by operating activities) = Current liabilities Accounts receivable turnover Net credit sales (or net sales) - Average net accounts receivable Number of days' sales in accounts Number of days in year (365) - receivable (average Accounts receivable collection period of accounts turnover receivable) Inventory turnover Cost of goods sold - Average inventory Test of quality of accounts receivable Test of quality accounts receivable Total assets turnover Net sales = Average total assets Test of whether or not a sufficient volume of business is being generated relative to inventory Test of whether or not the volume of business generated is adequate relative to amount of capital invested in the business Equity, or Long-Term Solvency, Ratios Equity (stockholders' equity) Stockholders' equity = Total ratio assets (or total equities) Stockholders' equity to debt Stockholders' equity = Total (debt to equity) ratio debt Index of long-run solvency and safety Measure of the relative proportion of stockholders' and of creditors' equities Profitability Tests Rate of return on operating assets Net income to net sales (return on sales) Net operating income Operating Measure of managerial assets or Operating margin x effectiveness Turnover of operating assets Net income = Net sales Indicator of the amount of net profit on each dollar of sales Net income + Average common Measure of what a given company stockholders' equity earned for its stockholders from all sources as a percentage of the common stockholders' investment Return on average common stockholders' equity Cash flow margin Measure of the ability of a firm to translate sales into cash Measure of the return to investors EPS of common stock Net cash provided by operating activities - Net sales Earnings available to common stockholders - Weighted- average number of common shares outstanding Income before interest and taxes = Interest expense Times interest earned ratio Times preferred dividends earned ratio Test of the likelihood that creditors will continue to receive their interest payments Test of the likelihood that preferred stockholders will receive their dividend each year Net income - Annual preferred dividends Market Tests Earnings yield on common stock Price-earnings ratio EPS + Current market price per share of common stock Current market price per share of common stock - EPS Payout ratio on common stock Dividend per share of common stock - EPS Comparison with other common stocks Index of whether a stock is relatively cheap or expensive based on ratio Index of whether company pays out a large percentage of earnings as dividends or reinvests most of its earnings Comparison with other common stocks Dividend yield on common stock Dividend yield on preferred stock Dividend per share of common stock - current market price per share of common stock Dividend per share of preferred stock - Current market price per share of preferred stock Net cash provided by operating activities - Average number of shares of common stock outstanding Comparison with other preferred stocks Cash flow per share of common stock Test of ability to pay dividends and liabilities CASE STUDY CASE STUDY ANALYSIS OF HASBRO, INC. The management of Hasbro, Inc. has approached your company concerning the operations of their business. Recognizing the importance of analyzing past results to determine if problems have arisen, the management of Hasbro, Inc. has requested that your company analyze their performance for the year ended December 27, 20x3. They have requested that your company provide for them a memo outlining the results of your study. 1. You should calculate all the ratios listed in Exhibit 17.3 for the year ended December 27, 20x3. Comment on your calculations. 2. Compare these ratios and percentages with the industry numbers provided from Dun & Bradstreet's Industry Norms & Key Business Ratios. Comment on Hasbro's position within the industry. 3. Perform a vertical analysis of Hasbro's balance sheet for 20x3 and 20x2. Comment on your results. Profile Hasbro, Inc., together with its subsidiaries, provides children's and family leisure time products and services worldwide. Its product offerings encompass various toys, including boys action figures, vehicles and play sets, girls toys, electronic toys, plush products, preschool toys and infant products, electronic interactive products, and creative play and toy-related specialty products; and games comprising action, board, card, electronic, trading card, and role-playing games. The company offers its products primarily under various brands, including TRANSFORMERS, NERF, LITTLEST PET SHOP, MY LITTLE PONY, BABY ALIVE, G.I. JOE, MONOPOLY, MAGIC: THE GATHERING, PLAY-DOH, and PLAYSKOOL. It also licenses its trademarks, characters, and other property rights to third parties for use in connection with digital gaming, consumer promotions, as well as for sale of non-competing toys and games, and non-toy products. Hasbro, Inc. was founded in 1923 and is headquartered in Pawtucket, Rhode Island. Consolidated Statements of Earnings Fiscal Years Ended in December (Thousands of Dollars Except Share Data) 20x3 $2,541,055 1,094,031 $1,447,024 20x2 $2,141,096 967,359 $1,173,737 20x1 $1,520,032 6 97,817 $ 822,215 194 $ 33,528 249,851 377,219 461.888 $1,122.486 $ 324,538 $ 29,330 192,451 325,282 389,301 $ 936,364 $ 237,373 $ 20,523 131,307 208,342 301.751 $ 661,923 $ 160,292 $ 35,891 $ 16,523 Net revenues .............................. ....... Cost of sales ............ Gross profit Expenses Amortization ..... Royalties, research and development ... Advertising ........ Selling, distribution and administrative ... Total expenses Operating profit .................. Nonoperating (income) expense Interest expense ............ Restructuring charge ....... Other (income), net ......... Total nonoperating expense ..... Earnings before income taxes and cumulative effect of changes in accounting principles Income taxes ......... Earnings before cumulative effect of changes in accounting principles Cumulative effect of changes in accounting principles Income taxes ............ Postretirement benefits ........... Net earnings Per common share Earnings ......... Cash dividends declared $ 42,597 59.000 (9,775) $ 91,822 (3,515) 32,376 (8,679) 7,844 $ $ $ 292,162 113,212 $ 145,551 63,897 $ 152,448 63.266 $ 178,950 $ 81,654 $ 89,182 12,349 (12,135) $ 179,164 $ 81,654 $ 89,182 $2.01 $.20 $.94 $.16 $1.02 $.13 See accompanying notes to consolidated financial statements. Consolidated Balance Sheets December 27, 20x3 and December 29, 20x2 (Thousands of Dollars Except Share Data) 20x3 20x2 $ 125,953 $ 120,614 Assets Current assets Cash and cash equivalents .... Accounts receivable, less allowance for doubtful accounts of $52,200 in 20x3 and $60,500 in 20x2 .. Inventories Prepaid expenses and other current assets ......... Total current assets Property, plant and equipment, net .............. Other assets Cost in excess of acquired net assets, less accumulated amortization of $53,514 in 20x3 and $41,400 in 20x2 ....... Other intangibles, less accumulated amortization of $65,497 in 20x3 and $59,179 in 20x2 Other Total other assets Total assets. 638,282 217,918 134,776 $1.116.929 $ 251,340 551,385 208,443 144,807 $1,025,249 $225,192 $ 484,278 $ 496,120 206,628 23,591 $ 714.497 $2.082.766 156,102 47,464 $ 699.686 $1.950,127 Liabilities and Shareholders' Equity Current liabilities Short-term borrowings ...... Trade payables Accrued liabilities .......... Income taxes ... Total current liabilities. $ 64,174 183,545 367,666 85,958 $ 701,343 $ 36,084 152,429 324,391 80,904 $ 593,808 Long-term debt, excluding current installments Deferred liabilities. Total liabilities ....... 206,189 69,613 $ 977,145 380,304 20,746 $ 994,858 $ $ - 43,588 43,397 Shareholders' equity Preference stock of $2.50 par value. Authorized 5,000,000 shares: none issued .. Common stock of $.50 par value. Authorized 150,000,000 shares; issued ............ 87,176,079 shares in 20x3 and 86,793,061 shares in 20x2 Additional paid-in capital Retained earnings ... Cumulative translation adjustments Treasury stock, at cost, no shares in 20x3 and 608,784 shares in 20x2 .............. Total shareholders' equity Total liabilities and shareholders' equity .......... .......... 287,478 741,987 32,568 276,725 580,211 60,297 (5,361) $ 955,269 $1,950,127 $1,105,621 $2,082,766 See accompanying notes to consolidated financial statements. Consolidated Statements of Cash Flows Fiscal Years Ended in December (Thousands of Dollars) 20x3 20x2 20x1 $ 179,164 $ 81,654 $ 89,182 62,087 33,528 2,228 52,524 29,330 (20,148) 39,734 20,523 (13,376) (132,935) (15,182) (53,564) 23,773 (9,673) 14,870 (2,029) 22,264 9,555 94,019 (2.654) $229,810 (8,135) 6,042 8,578 $ 120,054 141 $ 161,636 $ (36,168) $ (56,004) (343,392) Cash flows from operating activities Net earnings ....... Adjustments to reconcile net earnings to net cash provided (utilized) by operating activities: .. Depreciation and amortization of plant and equipment ............. Other amortization ............ Deferred income taxes ........ Change in current assets and liabilities (other than cash and cash equivalents): ............... Increase in accounts receivable ................. (Increase) decrease in inventories (Increase) decrease in prepaid expenses and other current assets Increase in trade payables and accrued liabilities ........... Other Net cash provided by operating activities Cash flows from investing activities Additions to property, plant and equipment Acquisitions, net of cash acquired Purchase of marketable securities ........ Sale of marketable securities Other Net cash utilized by investing activities Cash flows from financing activities Net (payments) proceeds of short-term borrowings ........ Proceeds from long-term debt Repayment of long-term debt .... Purchase of common stock Issuance of common stock ... Dividends paid Other Net cash provided (utilized) by financing activities Effect of exchange rate changes on cash ...... Increase (decrease) in cash and cash equivalents ...... Cash and cash equivalents at beginning of year .. Cash and cash equivalents at end of year Supplement information Cash paid during the year for Interest Income taxes ................ $ (90,431) (13,516) (144,000) 144,000 9.953 $ (93,994) ......... (5,004) $(404,400) (5.462) $ (41,630) $ 38,397 $1,720 $ (67,609) 300,000 (112,513) (161,413) 16,305 (16,476) ......... 17,458 (13,104) (2,646) $ 121,586 $ (5,923) $(168,683) 289,297 $ 120,614 $(123,187) $ (7,290) $ 5,339 120,614 $125,953 (68,996) (35,830) 1,008 (10,995) 662 $(112,431) $ 3,551 $ 11,126 278,171 $ 289,297 ......... $41,665 $83,160 $43,743 $91,562 $17,111 $51,228 See accompanying notes to consolidated financial statements. Consolidated Statements of Shareholders' Equity Fiscal Years Ended in December (Thousands of Dollars) 20x3 20x2 20x1 $ 43,397 $ 29,355 $ 28,931 14,466 Common stock Balance at beginning of year Three-for-two stock split ....... Stock option and warrant transactions ........ Purchased and retired ... Balance at end of year 191 46 (470) $ 28,931 $ 43.588 $ 43,397 $ 276,725 10,753 Additional paid-in capital Balance at beginning of year ............ Stock option and warrant transactions Three-for-two common stock split ..... Retirement of purchased common stock Balance at end of year .. $ 286,433 4,758 (14,466) $ 302,770 912 $ 287,478 $ 276,725 (17.249) S 286,433 Retained earnings Balance at beginning of year ..... Net earnings ......... Dividends declared ... Balance at end of year ....... $512,291 81,654 $ 580,211 179,164 (17.388) $ 741,987 $ 434,556 89,182 (11.447) S 512.291 $ 580,211 Cumulative translation adjustments Balance at beginning of year Equity adjustments from foreign currency translation Balance at end of year ... $ 60.297 _(27.729) $ 32.568 $ 58,233 2.064 $ 60,297 $ 35,643 22.590 $ 58.233 $ (5,361) $ (18,061) $ Treasury stock Balance at beginning of year Purchases Stock options and warrant transactions ...... Balance at end of year ................. (18,111) 5,361 SO 12,700 $ (5,361) $ (18,061) Total shareholders' equity .......... $1,105,621 $955,269 $867,827 See accompanying notes to consolidated financial statements. Additional information needed: 1. The weighted-average number of shares of common stock outstanding in 20x3 was 86,680 (thousand). 2. Assume that the current market price of the stock is the average of the high and low market prices of the stock for the full year (or $29.50 per share). High 35 -? Low 23. 3. The amount of dividends declared on common stock for 20x3 was $17,388,000. Calculations of the Fourteen Key Business Ratios SOLVENCY Current Liabilities to Inventory. Dividing EFFICIENCY Quick Ratio is computed by dividing cash plus current liabilities by inventory yields another Collection Period. Accounts receivable are account receivable by total current liabilities. indication of the extent to which the business divided by sales and then multiplied by 365 Current liabilities are all the liabilities that fall relies on funds from disposal of unsold days to obtain this figure. The quality of the due within one year. This ratio reveals the inventories to meet its debts. This ratio combines receivables of a company can be determined protection afforded short-term creditors in with Net Sales to Inventory to indicate how by this relationship when compared with cash or near-cash assets. It shows the number management controls inventory. It is possible to selling terms and industry norms. In some of dollars of liquid assets available to cover have decreasing liquidity while maintaining industries where credit sales are not the each dollar of current debt. Any time this ratio consistent sales-to-inventory ratios. Large normal way of doing business, the percentage is as much as 1 to 1 (1.0) the business is said increases in sales with corresponding increases in of cash sales should be taken into to be in a liquid condition. The larger the ratio inventory levels can cause an inappropriate rise in consideration. Generally, where most sales are the greater the liquidity. current liabilities if growth isn't made wisely. for credit, any collection period more than Current Ratio. Total current assets are Total Liabilities to Net Worth. Obtained by one-third over normal selling terms (40.0 for divided by total current liabilities. Current dividing total current plus long-term and deferred 30-day terms) is indicative of some slow assets include cash, accounts and notes liabilities by net worth. The effect of long-term turning receivables. When comparing the receivable (less reserves for bad debts), (funded) debt on a business can be determined by collection period of one concern with that of advances on inventories, merchandise comparing this ratio with Current Liabilities to another, allowances should be made for inventories, and marketable securities. This Net Worth. The difference will pinpoint the possible variations in selling terms. ratio measures the degree to which current relative size of long-term debt, which, if sizable, Net Sales to Inventory. Obtained by dividing assets cover current liabilities. The higher the can burden a firm with substantial interest annual net sales by inventory. Inventory ratio the more assurance exists that the charges. In general, total liabilities shouldn't control is a prime management objective since retirement of current liabilities can be made. exceed net worth (100 percent) since in such cases poor controls allow inventory to become The current ratio measures the margin of creditors have more at stake than owners. costly to store, obsolete or insufficient to meet safety available to cover any possible Fixed Assets to Net Worth. Fixed assets are demands. The sales-to-inventory relationship shrinkage in the value of current assets. divided by net worth. The proportion of net worth is a guide to the rapidity at which merchandise Normally a ratio of 2 to 1 (2.0) or better is that consists of fixed assets will vary greatly from is being moved and the effect on the flow of considered good. industry to industry but generally a smaller funds into the business. This ratio varies Current Liabilities to Net Worth is derived proportion is desirable. A high ratio is unfavorable widely between different lines of business and by dividing current liabilities by net worth. because heavy investment in fixed assets indicates a company's figure is only meaningful when This contrasts the funds that creditors that either the concern has a low net working compared with industry norms. Individual temporarily are risking with the funds capital and is overtrading or has utilized large figures that are outside either the upper or permanently invested by the owners. The funded debt to supplement working capital. Also, lower quartiles for a given industry should be smaller the net worth and the larger the the larger the fixed assets, the bigger the annual examined with care. Although low figures are liabilities, the less security for the creditors. depreciation charge that must be deducted from usually the biggest problem, as they indicate Care should be exercised when selling any the income statement. Normally, fixed assets excessively high inventories, extremely high firm with current liabilities exceeding two- above 75 percent of net worth indicate possible turnovers might reflect insufficient thirds (66.6 percent) of net worth. over-investment and should be examined with merchandise to meet customer demand and care. result in lost sales. Assets to Sales is calculated by dividing total assets by annual net sales. This ratio ties in sales and the total investment that is used to generate those sales. While figures vary greatly from industry to industry, by comparing a company's ratio with industry norms it can be determined whether a firm is overtrading (handling an excessive PROFITABILITY volume of sales in relation to investment) or Return on Sales (Profit Margin) is obtained undertrading (not generating sufficient sales to by dividing net profit after taxes by annual net warrant the assets invested). Abnormally low sales. This reveals the profits earned per dollar percentages (above the upper quartile) can of sales and therefore measures the efficiency indicate overtrading which may lead to of the operation. Return must be adequate for financial difficulties if not corrected the firm to be able to achieve satisfactory Extremely high percentages (below the lower profits for its owners. This ratio is an indicator quartile) can be the result of overly of the firm's ability to withstand adverse conservative or poor sales management, conditions such as falling prices, rising costs indicating a more aggressive sales policy may and declining sales. need to be followed. Return on Assets. Net profit after taxes Sales to Net Working Capital. Net sales are divided by total assets. This ratio is the key divided by net working capital. (Net working indicator of profitability for a firm. It matches capital is current assets minus current operating profits with the assets available to liabilities.) This relationship indicates whether earn a return. Companies efficiently using a company is overtrading or conversely their assets will have a relatively high return carrying more liquid assets than needed for its while less well-run businesses will be volume. Each industry can vary substantially relatively low. and it is necessary to compare a company with Return on Net Worth (Return on Equity) is its peers to see if it is either overtrading on its obtained by dividing net profit after tax by net available funds or being overly conservative. worth. This ratio is used to analyze the ability Companies with substantial sales gains often of the firm's management to realize an reach a level where their working capital adequate return on the capital invested by the becomes strained. Even if they maintain an owners of the firm. Tendency is to look adequate total investment for the volume increasingly to this ratio as a final criterion of being generated (Assets to Sales), that profitability. Generally, a relationship of at investment may be so centered in fixed assets least 10 percent is regarded as a desirable or other noncurrent items that it will be objective for providing dividends plus funds difficult to continue meeting all current for future growth. obligations without additional investment or reducing sales. Accounts Payable to Sales. Computed by dividing accounts payable by annual net sales. This ratio measures how the company is paying its suppliers in relation to the volume being transacted. An increasing percentage, or one larger than the industry norm, indicates the firm may be using suppliers to help finance operations. This ratio is especially important to short-term creditors since a high percentage could indicate potential problems in paying vendors. Significance Test of debt-paying ability Test of immediate debt-paying ability Test of short-term, debt-paying ability EXHIBIT 17.3 Summary of Ratios Ratio Formula Liquidity Ratios Current, or working Current assets Current capital, ratio Liabilities Acid-test (quick) ratio Quick assets (Cash + Marketable securities - Net receivables) Current liabilities Cash flow liquidity ratio (Cash and marketable securities + Net cash provided by operating activities) = Current liabilities Accounts receivable turnover Net credit sales (or net sales) - Average net accounts receivable Number of days' sales in accounts Number of days in year (365) - receivable (average Accounts receivable collection period of accounts turnover receivable) Inventory turnover Cost of goods sold - Average inventory Test of quality of accounts receivable Test of quality accounts receivable Total assets turnover Net sales = Average total assets Test of whether or not a sufficient volume of business is being generated relative to inventory Test of whether or not the volume of business generated is adequate relative to amount of capital invested in the business Equity, or Long-Term Solvency, Ratios Equity (stockholders' equity) Stockholders' equity = Total ratio assets (or total equities) Stockholders' equity to debt Stockholders' equity = Total (debt to equity) ratio debt Index of long-run solvency and safety Measure of the relative proportion of stockholders' and of creditors' equities Profitability Tests Rate of return on operating assets Net income to net sales (return on sales) Net operating income Operating Measure of managerial assets or Operating margin x effectiveness Turnover of operating assets Net income = Net sales Indicator of the amount of net profit on each dollar of sales Net income + Average common Measure of what a given company stockholders' equity earned for its stockholders from all sources as a percentage of the common stockholders' investment Return on average common stockholders' equity Cash flow margin Measure of the ability of a firm to translate sales into cash Measure of the return to investors EPS of common stock Net cash provided by operating activities - Net sales Earnings available to common stockholders - Weighted- average number of common shares outstanding Income before interest and taxes = Interest expense Times interest earned ratio Times preferred dividends earned ratio Test of the likelihood that creditors will continue to receive their interest payments Test of the likelihood that preferred stockholders will receive their dividend each year Net income - Annual preferred dividends Market Tests Earnings yield on common stock Price-earnings ratio EPS + Current market price per share of common stock Current market price per share of common stock - EPS Payout ratio on common stock Dividend per share of common stock - EPS Comparison with other common stocks Index of whether a stock is relatively cheap or expensive based on ratio Index of whether company pays out a large percentage of earnings as dividends or reinvests most of its earnings Comparison with other common stocks Dividend yield on common stock Dividend yield on preferred stock Dividend per share of common stock - current market price per share of common stock Dividend per share of preferred stock - Current market price per share of preferred stock Net cash provided by operating activities - Average number of shares of common stock outstanding Comparison with other preferred stocks Cash flow per share of common stock Test of ability to pay dividends and liabilities
Step by Step Solution
There are 3 Steps involved in it

Get step-by-step solutions from verified subject matter experts