CASE STUDY
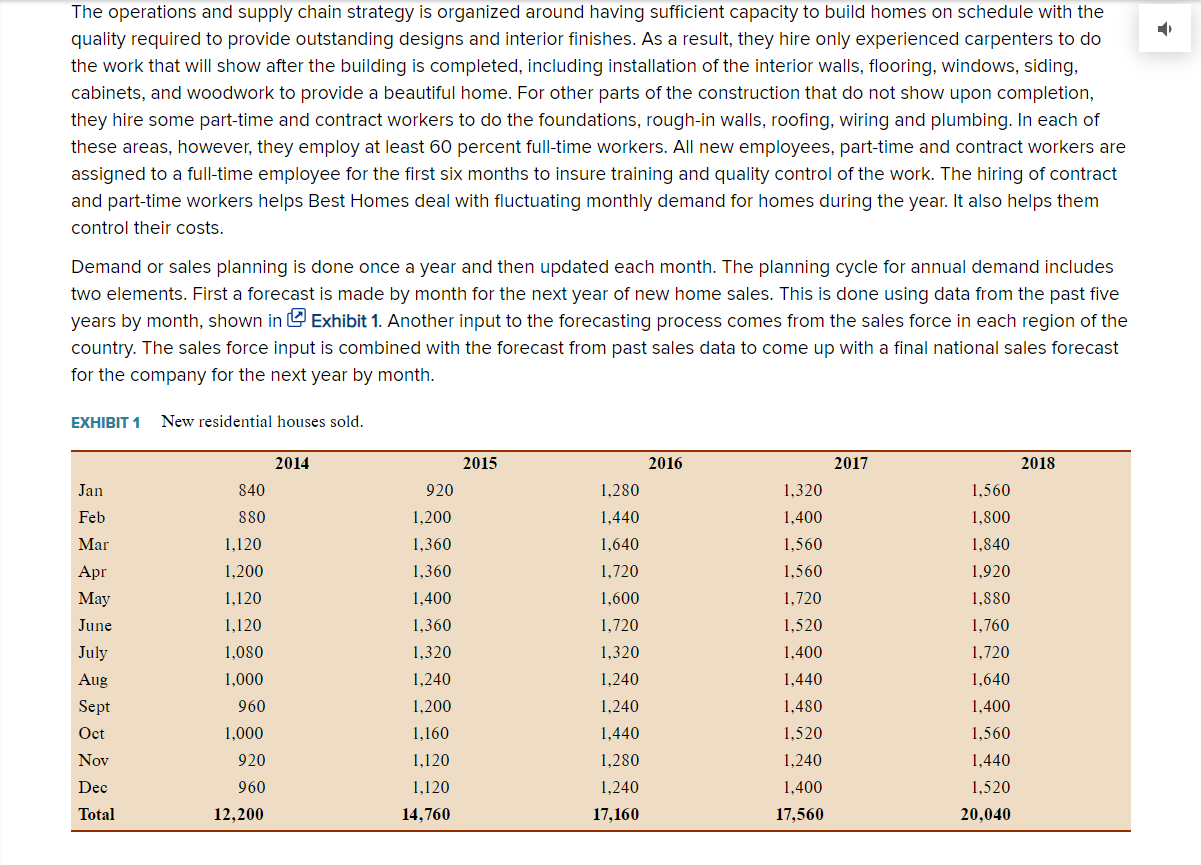
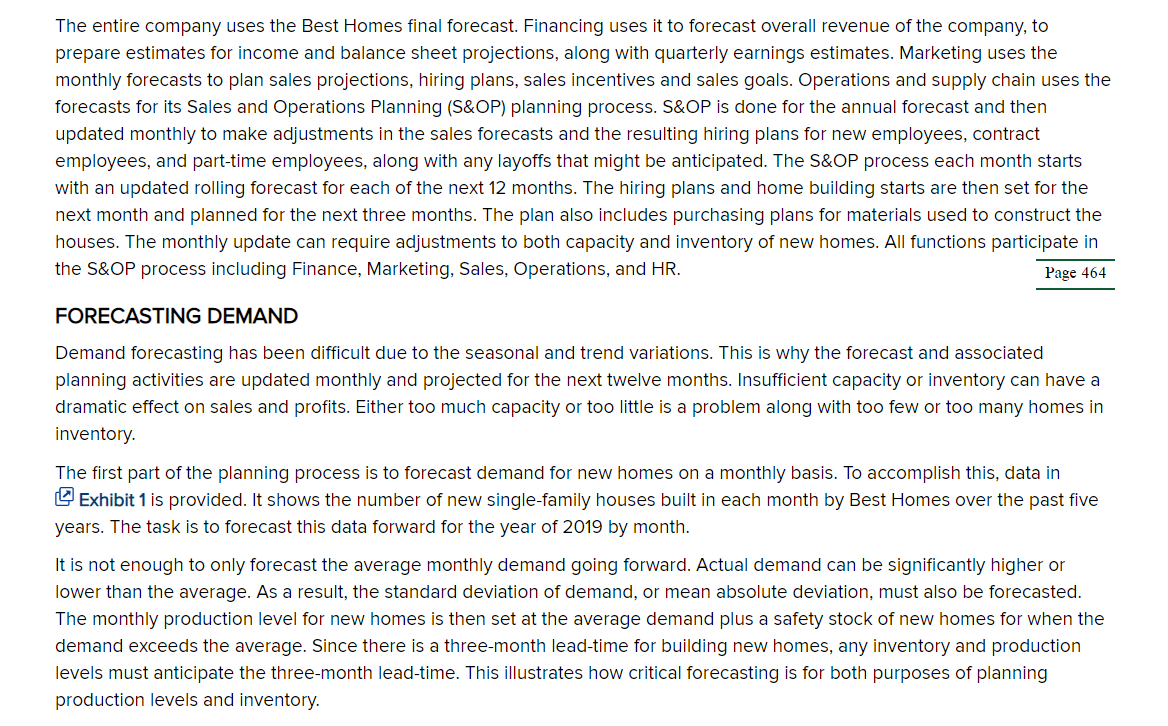
Case Study Best Homes, Inc.: Forecasting excel Best Homes is a new home construction company with headquarters in Kansas City, Missouri. They construct only Page 463 residential homes throughout the U.S. and only new homes. Having started on the East coast in 1945 they expanded to the Midwest and ultimately to the west coast and the South. They build all types of residential new homes from low-end prices to the high-end of the market. Best Homes was a private company until 1958 when it made its first public offering. While the company started small, it has expanded to become one of the largest homebuilders in America. In 2018 Best Homes built 20,040 new homes with revenue of $6.4 billion in sales. Their sales were 3.2 percent of the national home market of over 627,000 new homes." COMPANY STRATEGY AND PLANNING CYCLE Best Homes competes based on its excellent brand reputation. Their reputation is earned by building quality homes at a competitive price. The cost per square foot of their homes is comparable to competitors, but the design and interior finish of their homes is outstanding. This provides an advantage that competitors find hard to meet. D The operations and supply chain strategy is organized around having sufficient capacity to build homes on schedule with the quality required to provide outstanding designs and interior finishes. As a result, they hire only experienced carpenters to do the work that will show after the building is completed, including installation of the interior walls, flooring, windows, siding, cabinets, and woodwork to provide a beautiful home. For other parts of the construction that do not show upon completion, they hire some part-time and contract workers to do the foundations, rough-in walls, roofing, wiring and plumbing. In each of these areas, however, they employ at least 60 percent full-time workers. All new employees, part-time and contract workers are assigned to a full-time employee for the first six months to insure training and quality control of the work. The hiring of contract and part-time workers helps Best Homes deal with fluctuating monthly demand for homes during the year. It also helps them control their costs. Demand or sales planning is done once a year and then updated each month. The planning cycle for annual demand includes two elements. First a forecast is made by month for the next year of new home sales. This is done using data from the past five years by month, shown in Exhibit 1. Another input to the forecasting process comes from the sales force in each region of the country. The sales force input is combined with the forecast from past sales data to come up with a final national sales forecast for the company for the next year by month. EXHIBIT 1 New residential houses sold. 2014 2015 2016 2017 2018 Jan Feb 840 880 1,120 Mar Apr May June 920 1,200 1,360 1,360 1,400 1,360 1,320 1,240 1,200 1,160 1,120 1,120 1,200 1,120 1,120 1,080 1,000 960 1,000 920 1,280 1,440 1,640 1,720 1,600 1,720 1,320 1,240 1,240 1,440 1,280 1,240 17,160 1,320 1,400 1,560 1,560 1,720 1,520 1,400 1,440 1,480 1,520 1,240 July 1,560 1.800 1,840 1,920 1,880 1,760 1,720 1,640 1,400 1,560 1,440 Aug Sept Oct Nov Dec 960 1,400 17,560 1,520 20,040 Total 12,200 14,760 The entire company uses the Best Homes final forecast. Financing uses it to forecast overall revenue of the company, to prepare estimates for income and balance sheet projections, along with quarterly earnings estimates. Marketing uses the monthly forecasts to plan sales projections, hiring plans, sales incentives and sales goals. Operations and supply chain uses the forecasts for its Sales and Operations Planning (S&OP) planning process. S&OP is done for the annual forecast and then updated monthly to make adjustments in the sales forecasts and the resulting hiring plans for new employees, contract employees, and part-time employees, along with any layoffs that might be anticipated. The S&OP process each month starts with an updated rolling forecast for each of the next 12 months. The hiring plans and home building starts are then set for the next month and planned for the next three months. The plan also includes purchasing plans for materials used to construct the houses. The monthly update can require adjustments to both capacity and inventory of new homes. All functions participate in the S&OP process including Finance, Marketing, Sales, Operations, and HR. Page 464 FORECASTING DEMAND Demand forecasting has been difficult due to the seasonal and trend variations. This is why the forecast and associated planning activities are updated monthly and projected for the next twelve months. Insufficient capacity or inventory can have a dramatic effect on sales and profits. Either too much capacity or too little is a problem along with too few or too many homes in inventory. The first part of the planning process is to forecast demand for new homes on a monthly basis. To accomplish this, data in Exhibit 1 is provided. It shows the number of new single-family houses built in each month by Best Homes over the past five years. The task is to forecast this data forward for the year of 2019 by month. It is not enough to only forecast the average monthly demand going forward. Actual demand can be significantly higher or lower than the average. As a result, the standard deviation of demand, or mean absolute deviation, must also be forecasted. The monthly production level for new homes is then set at the average demand plus a safety stock of new homes for when the demand exceeds the average. Since there is a three-month lead-time for building new homes, any inventory and production levels must anticipate the three-month lead-time. This illustrates how critical forecasting is for both purposes of planning production levels and inventory. SALES FORECAST Best Homes collects information from its national sales force to try to improve its forecasts for upcoming years. The sales force is rewarded with annual bonuses if they meet certain goals in terms of the number of houses sold. Sales of new houses were robust for Best Homes in 2018, and most of the sales force was very happy with their bonuses, after few of them received bonuses the previous year. Looking forward to 2019, there is early word from the sales force that they believe sales will be 20 percent higher than in 2018. Discussion Questions 1. What forecasting analytics should the company consider? Describe why other forecasting analytics may not be good options. 2. Based on past demand (Exhibit 1), use the classical decomposition method to forecast average demand for the upcoming year, by month. 3. The second step in Best Homes' forecasting process is to collect sales projections from each of its regions. What types of data should they collect from the sales force? How should they integrate sales data with your answer in question 2? This case was prepared by Roger G. Schroeder for class discussion. Copyright by Roger G. Schroeder, 2016, 2019. All rights are reserved. Reprinted with permission. Case Study Best Homes, Inc.: Forecasting excel Best Homes is a new home construction company with headquarters in Kansas City, Missouri. They construct only Page 463 residential homes throughout the U.S. and only new homes. Having started on the East coast in 1945 they expanded to the Midwest and ultimately to the west coast and the South. They build all types of residential new homes from low-end prices to the high-end of the market. Best Homes was a private company until 1958 when it made its first public offering. While the company started small, it has expanded to become one of the largest homebuilders in America. In 2018 Best Homes built 20,040 new homes with revenue of $6.4 billion in sales. Their sales were 3.2 percent of the national home market of over 627,000 new homes." COMPANY STRATEGY AND PLANNING CYCLE Best Homes competes based on its excellent brand reputation. Their reputation is earned by building quality homes at a competitive price. The cost per square foot of their homes is comparable to competitors, but the design and interior finish of their homes is outstanding. This provides an advantage that competitors find hard to meet. D The operations and supply chain strategy is organized around having sufficient capacity to build homes on schedule with the quality required to provide outstanding designs and interior finishes. As a result, they hire only experienced carpenters to do the work that will show after the building is completed, including installation of the interior walls, flooring, windows, siding, cabinets, and woodwork to provide a beautiful home. For other parts of the construction that do not show upon completion, they hire some part-time and contract workers to do the foundations, rough-in walls, roofing, wiring and plumbing. In each of these areas, however, they employ at least 60 percent full-time workers. All new employees, part-time and contract workers are assigned to a full-time employee for the first six months to insure training and quality control of the work. The hiring of contract and part-time workers helps Best Homes deal with fluctuating monthly demand for homes during the year. It also helps them control their costs. Demand or sales planning is done once a year and then updated each month. The planning cycle for annual demand includes two elements. First a forecast is made by month for the next year of new home sales. This is done using data from the past five years by month, shown in Exhibit 1. Another input to the forecasting process comes from the sales force in each region of the country. The sales force input is combined with the forecast from past sales data to come up with a final national sales forecast for the company for the next year by month. EXHIBIT 1 New residential houses sold. 2014 2015 2016 2017 2018 Jan Feb 840 880 1,120 Mar Apr May June 920 1,200 1,360 1,360 1,400 1,360 1,320 1,240 1,200 1,160 1,120 1,120 1,200 1,120 1,120 1,080 1,000 960 1,000 920 1,280 1,440 1,640 1,720 1,600 1,720 1,320 1,240 1,240 1,440 1,280 1,240 17,160 1,320 1,400 1,560 1,560 1,720 1,520 1,400 1,440 1,480 1,520 1,240 July 1,560 1.800 1,840 1,920 1,880 1,760 1,720 1,640 1,400 1,560 1,440 Aug Sept Oct Nov Dec 960 1,400 17,560 1,520 20,040 Total 12,200 14,760 The entire company uses the Best Homes final forecast. Financing uses it to forecast overall revenue of the company, to prepare estimates for income and balance sheet projections, along with quarterly earnings estimates. Marketing uses the monthly forecasts to plan sales projections, hiring plans, sales incentives and sales goals. Operations and supply chain uses the forecasts for its Sales and Operations Planning (S&OP) planning process. S&OP is done for the annual forecast and then updated monthly to make adjustments in the sales forecasts and the resulting hiring plans for new employees, contract employees, and part-time employees, along with any layoffs that might be anticipated. The S&OP process each month starts with an updated rolling forecast for each of the next 12 months. The hiring plans and home building starts are then set for the next month and planned for the next three months. The plan also includes purchasing plans for materials used to construct the houses. The monthly update can require adjustments to both capacity and inventory of new homes. All functions participate in the S&OP process including Finance, Marketing, Sales, Operations, and HR. Page 464 FORECASTING DEMAND Demand forecasting has been difficult due to the seasonal and trend variations. This is why the forecast and associated planning activities are updated monthly and projected for the next twelve months. Insufficient capacity or inventory can have a dramatic effect on sales and profits. Either too much capacity or too little is a problem along with too few or too many homes in inventory. The first part of the planning process is to forecast demand for new homes on a monthly basis. To accomplish this, data in Exhibit 1 is provided. It shows the number of new single-family houses built in each month by Best Homes over the past five years. The task is to forecast this data forward for the year of 2019 by month. It is not enough to only forecast the average monthly demand going forward. Actual demand can be significantly higher or lower than the average. As a result, the standard deviation of demand, or mean absolute deviation, must also be forecasted. The monthly production level for new homes is then set at the average demand plus a safety stock of new homes for when the demand exceeds the average. Since there is a three-month lead-time for building new homes, any inventory and production levels must anticipate the three-month lead-time. This illustrates how critical forecasting is for both purposes of planning production levels and inventory. SALES FORECAST Best Homes collects information from its national sales force to try to improve its forecasts for upcoming years. The sales force is rewarded with annual bonuses if they meet certain goals in terms of the number of houses sold. Sales of new houses were robust for Best Homes in 2018, and most of the sales force was very happy with their bonuses, after few of them received bonuses the previous year. Looking forward to 2019, there is early word from the sales force that they believe sales will be 20 percent higher than in 2018. Discussion Questions 1. What forecasting analytics should the company consider? Describe why other forecasting analytics may not be good options. 2. Based on past demand (Exhibit 1), use the classical decomposition method to forecast average demand for the upcoming year, by month. 3. The second step in Best Homes' forecasting process is to collect sales projections from each of its regions. What types of data should they collect from the sales force? How should they integrate sales data with your answer in question 2? This case was prepared by Roger G. Schroeder for class discussion. Copyright by Roger G. Schroeder, 2016, 2019. All rights are reserved. Reprinted with permission