Case Study
In mid-2014, Snehlata Malhotra sat in her home office and pondered her personal investment strategy. In order to fund her children's educational savings for the future, she was looking to invest in high growth stocks that were trading below their fair value (undervalued). Based on her understanding of the market and publicly available equity reports, she had narrowed her search to Federal Bank Limited (Federal Bank), a Kerala-based, old generation private sector bank with a balance sheet of nearly 700 billion.1 Federal Bank stock had fallen from a price of 54 in December 2012 to 46 on May 9, 2014 (see Exhibit 1). While the decrease was a part of market-wide volatility due to global economic uncertainties at the time, the Federal Bank stock had been affected more by large investments from foreign institutional investorsa total of 41 per cent of shares as of March 30, 2014.2 Malhotra wondered whether such a fall in price was warranted given Federal Bank's strong fundamentals. Could Federal Bank be the undervalued investment Malhotra was looking for? What would be the fair fundamental value of Federal Bank? During her student days, Malhotra learned how to use the dividend discount model, a technique to identify and value potential undervalued stocks. She decided to use that traditional model to value the Federal Bank.
VALUING FEDERAL BANK: DIVIDEND DISCOUNT VALUATION METHOD
The dividend discount valuation approach involved finding the present value of all of the bank's future dividends during the forecasted period, and then discounting that value at the computed cost of equity. The result was the intrinsic value of the stock.
Forecasting Future Data for Dividend Discount Valuation
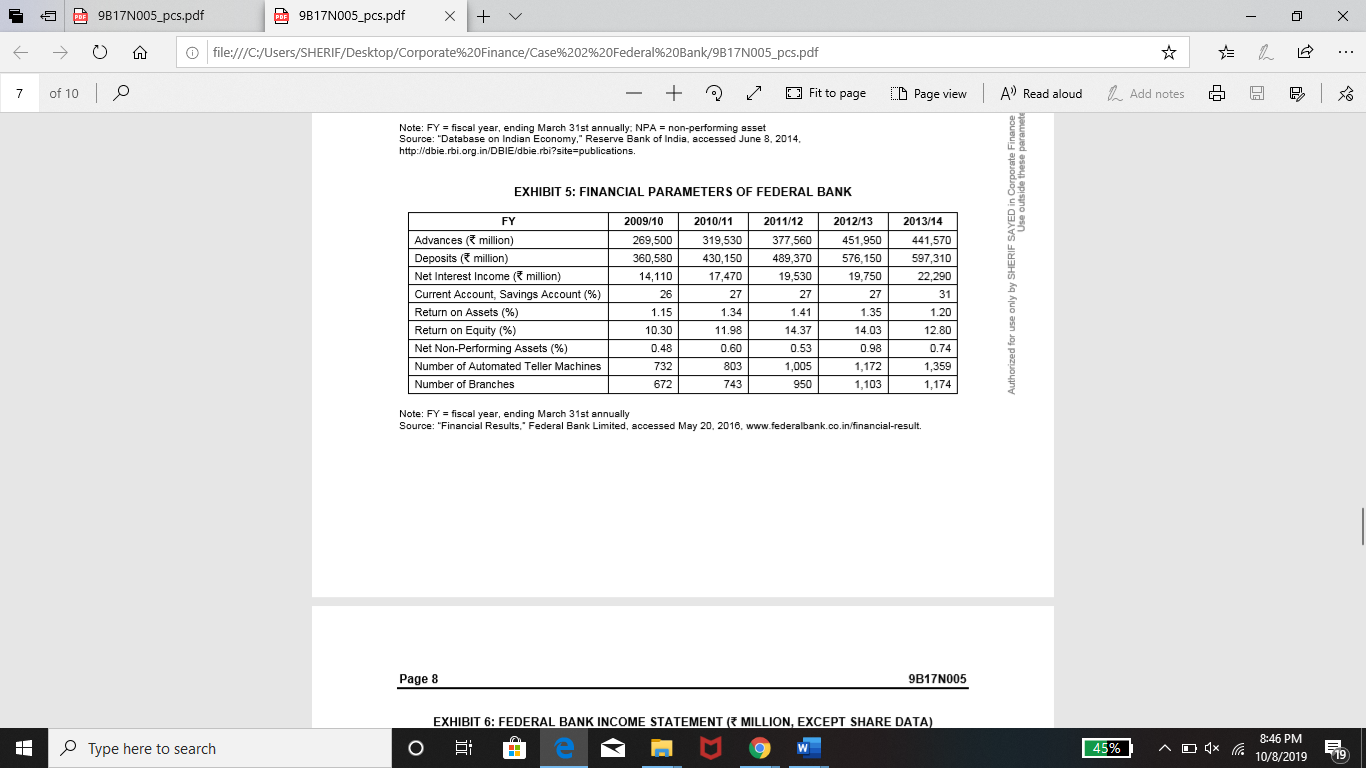
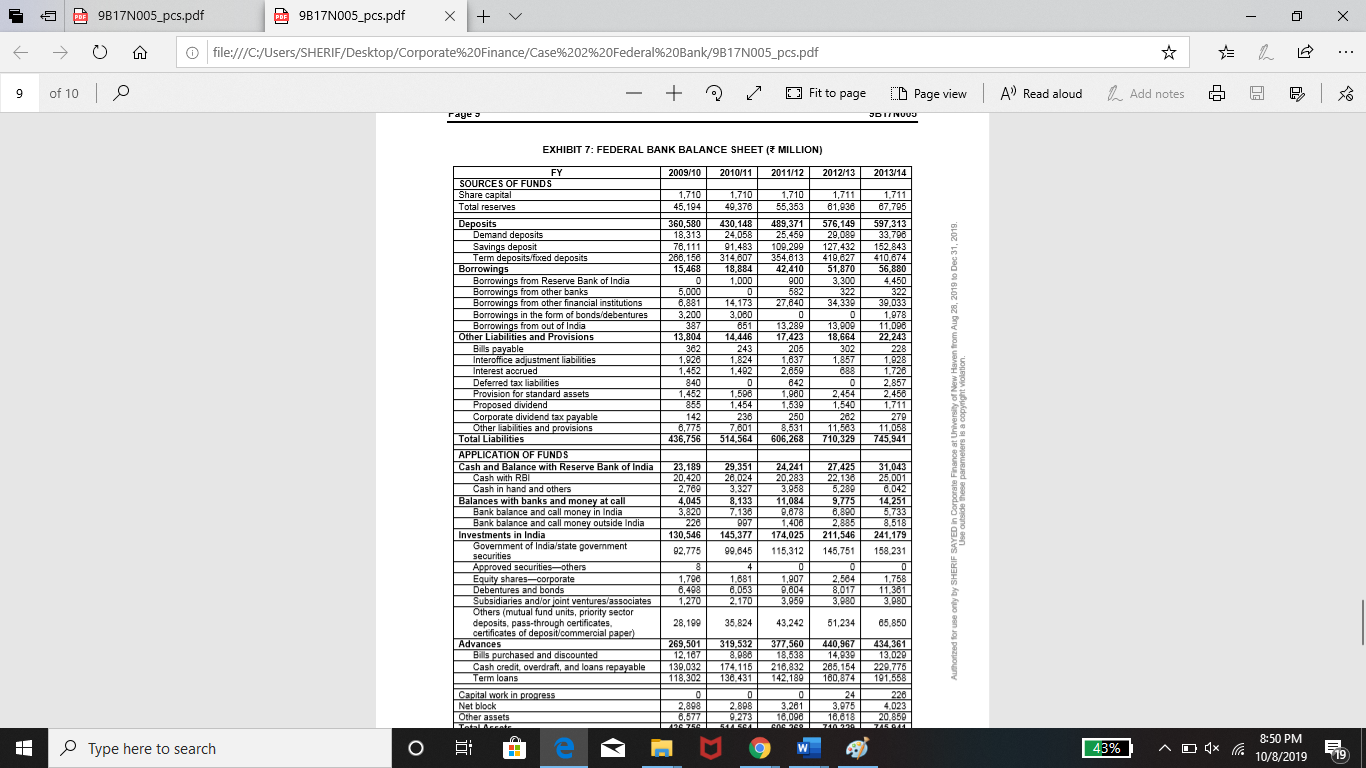
To forecast the future dividends for the valuation exercise, Malhotra needed to forecast the Federal Bank's financial statements (see Exhibits 6 and 7). Given management's future outlook and the bank's strong financial position, Malhotra was confident that the Federal Bank would be able to grow its loan book at approximately 15 per cent per year for the next five years, until 2019. To forecast the deposits, Malhotra assumed a constant advances-deposit ratio in line with FY 2013/14. Fee growth and provisions were assumed to increase in line with the loan growth in the future. Malhotra further assumed that net interest margins, cost-income ratio, cash and bank balances, and CASAs would be stable and in line with the FY 2013/14 levels. A tax rate of 30 per cent was a reasonable assumption to work with. The notable change Malhotra expected was a growth in the dividend payout ratio to about 30 per centthe higher figure reflecting the bank's strong financial position.
The final consideration for Malhotra was determining the cost of equity that would be used as the discounting factor. To sort out the cost of equity, Malhotra estimated that the one-year beta for Federal Bank would be 1.1 and the average equity risk premium for India was 5 per cent. She visited the RBI's website to get information about the risk-free rate. She learned that the yield on India's 10-year government
treasury securities was 8.84 per cent on March 31, 2014.14
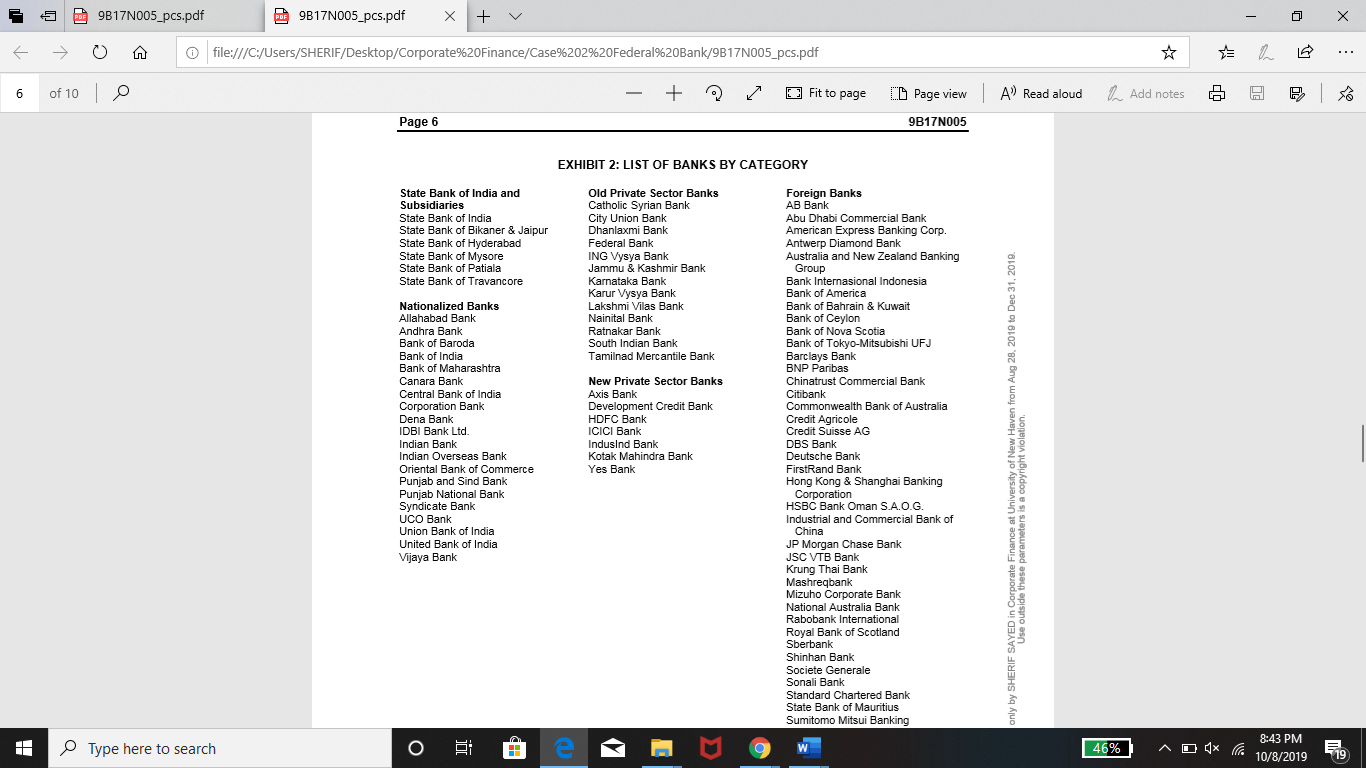
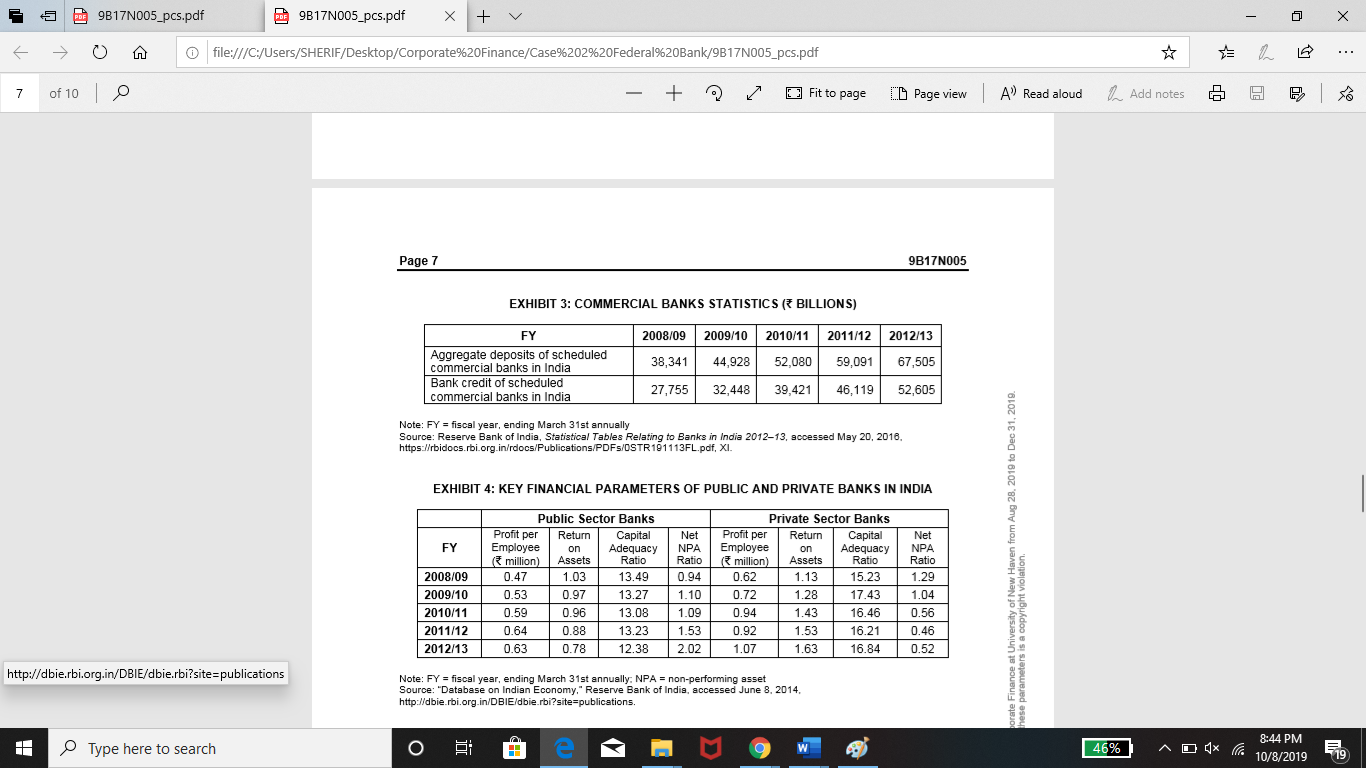
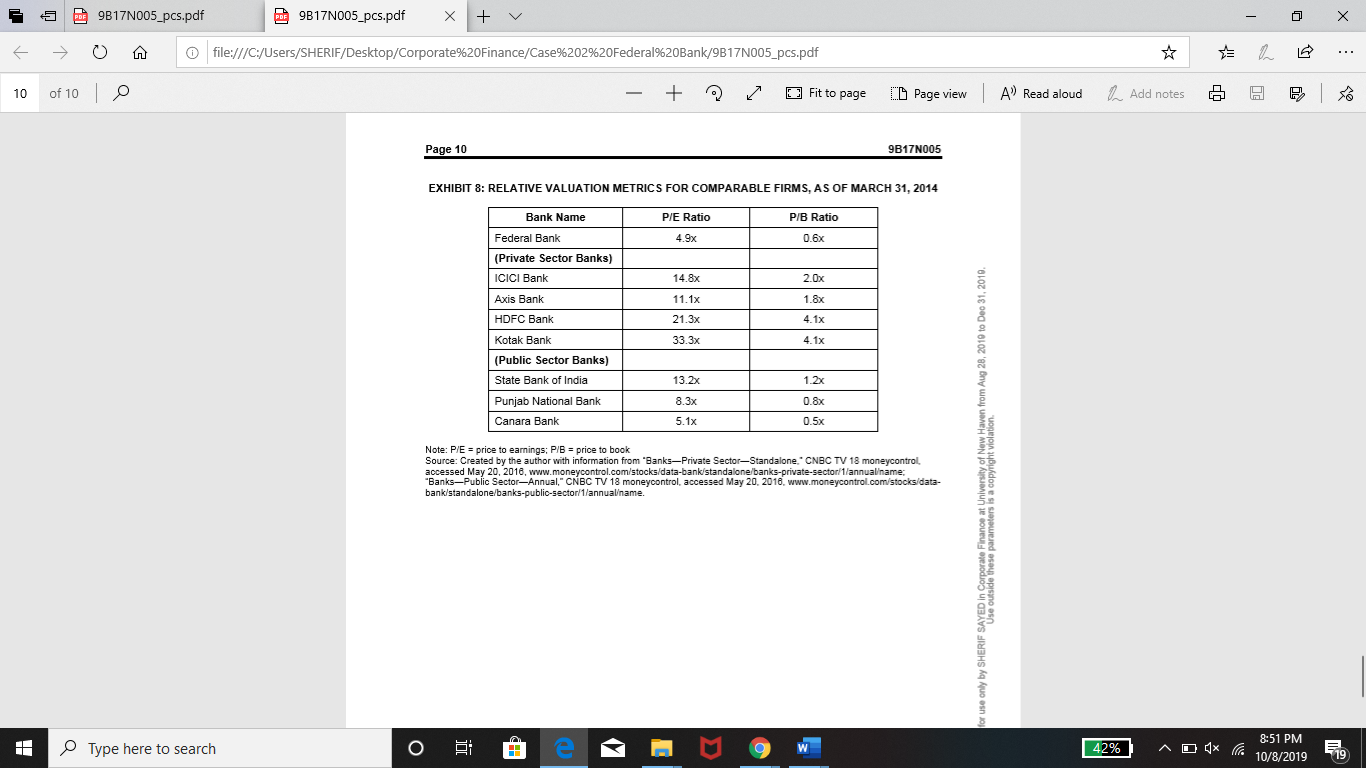
Before proceeding to the dividend discount valuation, Malhotra also collected data on the price to earnings (P/E) ratios and price to book (P/B) ratios for comparable banks, so she could assess the Federal Bank's relative valuation (see Exhibit 8). The P/E ratio tended to indicate how much investors were willing to pay for each Indian rupee earned. The P/B ratio, on the other hand, compared the bank's stock price to the reported book value for shares. Both ratios were widely used to compare the metrics of a particular company to its peer set or industry competitors.
With all this information in hand, Malhotra set out to value Federal Bank using the dividend discount model. She wondered whether her calculated fair value would be higher or lower than the market price, and whether Federal Bank would, in fact, be the stock she was looking for.
Question
What is the intrinsic value of Federal Bank using the dividend discount valuation
model?Show the variables value selection and calculation.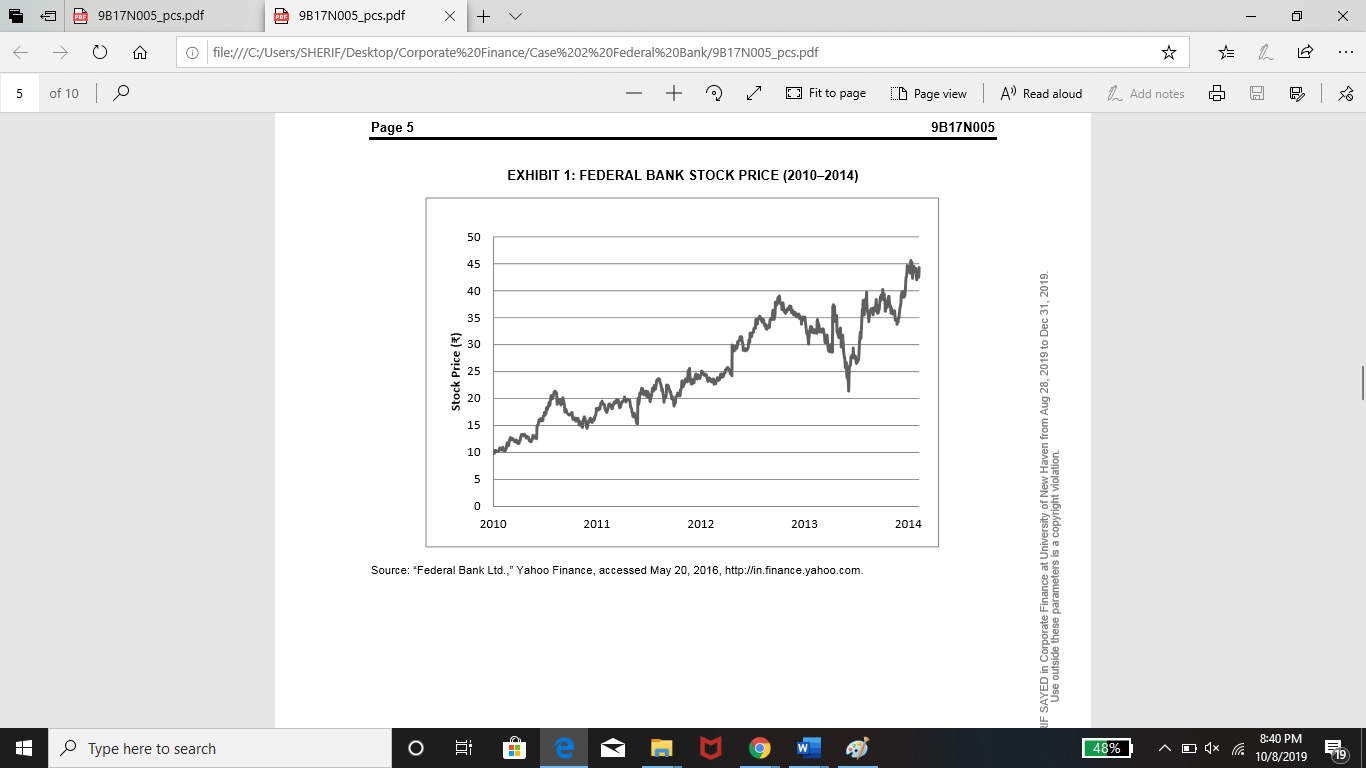
55 9817N005_pcs.pdf 9817N005_pcs.pdf x + V D - x 0 file:///C:/Users/SHERIF/Desktop/Corporate%20Finance/Case%202%20Federal%20Bank/9B17N005_pcs.pdf 6 of 10 o - + Fit to page AV Read aloud Add notes F ID Page view 9B17N005 Page 6 EXHIBIT 2: LIST OF BANKS BY CATEGORY State Bank of India and Subsidiaries State Bank of India State Bank of Bikaner & Jaipur State Bank of Hyderabad State Bank of Mysore State Bank of Patiala State Bank of Travancore Old Private Sector Banks Catholic Syrian Bank City Union Bank Dhanlaxmi Bank Federal Bank ING Vysya Bank Jammu & Kashmir Bank Karnataka Bank Karur Vysya Bank Lakshmi Vilas Bank Nainital Bank Ratnakar Bank South Indian Bank Tamilnad Mercantile Bank Nationalized Banks Allahabad Bank Andhra Bank Bank of Baroda Bank of India Bank of Maharashtra Canara Bank Central Bank of India Corporation Bank Dena Bank IDBI Bank Ltd. Indian Bank Indian Overseas Bank Oriental Bank of Commerce Punjab and Sind Bank Punjab National Bank Syndicate Bank UCO Bank Union Bank of India United Bank of India Vijaya Bank New Private Sector Banks Axis Bank Development Credit Bank HDFC Bank ICICI Bank IndusInd Bank Kotak Mahindra Bank Yes Bank Foreign Banks AB Bank Abu Dhabi Commercial Bank American Express Banking Corp. Antwerp Diamond Bank Australia and New Zealand Banking Group Bank Internasional Indonesia Bank of America Bank of Bahrain & Kuwait Bank of Ceylon Bank of Nova Scotia Bank of Tokyo-Mitsubishi UFJ Barclays Bank BNP Paribas Chinatrust Commercial Bank Citibank Commonwealth Bank of Australia Credit Agricole Credit Suisse AG DBS Bank Deutsche Bank FirstRand Bank Hong Kong & Shanghai Banking Corporation HSBC Bank Oman S.A.O.G. Industrial and Commercial Bank of China JP Morgan Chase Bank JSC VTB Bank Krung Thai Bank Mashreqbank Mizuho Corporate Bank National Australia Bank Rabobank International Royal Bank of Scotland Sberbank Shinhan Bank Societe Generale Sonali Bank Standard Chartered Bank State Bank of Mauritius Sumitomo Mitsui Banking only by SHERIF SAYED in Corporate Finance at University of New Haven from Aug 28, 2019 to Dec 31, 2019 Use outside these parameters is a copyright violation 8:43 PM Type here to search 46% - 0 1x la 10/8/2019 19 5 9817N005_pcs.pdf 9817N005_pcs.pdf x + V 0 file:///C:/Users/SHERIF/Desktop/Corporate%20Finance/Case%202%20Federal%20Bank/9B17N005_pcs.pdf 7 of 100 - + Fit to page ID Page view AV Read aloud b Add notes Page 7 9B17N005 EXHIBIT 3: COMMERCIAL BANKS STATISTICS ( BILLIONS) FY Aggregate deposits of scheduled commercial banks in India Bank credit of scheduled commercial banks in India 2008/09 38,341 27,755 2009/10 44,928 32,448 2010/11 52,080 39,421 2011/12 59,091 46,119 2012/13 67,505 52,605 Note: FY = fiscal year, ending March 31st annually Source: Reserve Bank of India, Statistical Tables Relating to Banks in India 2012-13, accessed May 20, 2010, https://rbidocs.rbi.org.in/docs/Publications/PDFs/OSTR101113FL.pdf, XI. EXHIBIT 4: KEY FINANCIAL PARAMETERS OF PUBLIC AND PRIVATE BANKS IN INDIA FY Public Sector Banks Profit per Return Capital Employee on Adequacy (million) Assets Ratio 0.47 1.03 13.49 0.53 0.97 13.27 0.59 0.96 13.08 0.64 0.88 13.23 0.63 0.78 12.38 2008/09 2009/10 2010/11 2011/12 13 0 Net NPA Ratio .94 1.10 1.09 1.53 2.02 porate Finance at University of New Haven from Aug 28, 2019 to Dec 31, 2019 hese parameters is a copyright violation Private Sector Banks Profit per Return Capital | Net Employee on Adequacy NPA 1 million) Assets Ratio Ratio 0.62 | 1.13 15 23 1.29 0.72 1.28 17.43 1.04 0.94 16.46 0.56 0.92 16.21 0.46 1.07 1.63 16.84 0.52 http://dbie.rbi.org.in/DBIE/dbie.rbi?site=publications Note: FY = fiscal year, ending March 31st annually: NPA = non-performing asset Source: "Database on Indian Economy." Reserve Bank of India, accessed June 8, 2014, http://dbie.rbi.org.in/DBIE/dbie.rbi?site=publications. 8:44 PM Type here to search 46% - 0 1x la 10/8/2019 19 55 9817N005_pcs.pdf 9817N005_pcs.pdf x + V 0 file:///C:/Users/SHERIF/Desktop/Corporate%20Finance/Case%202%20Federal%20Bank/9B17N005_pcs.pdf 9 of 10 - + Fit to page ID Page view JDIT NOUS AV Read aloud Add notes F raye EXHIBIT 7: FEDERAL BANK BALANCE SHEET ( MILLION) FY 2009/10 2010/11 2011/12 2012/13 2013/14 SOURCES OF FUNDS Share capital Total reserves 1.710 49,378 1,710 55,353 1,711 81,938 1.711 87,795 1.710 45,194 360,580 18.313 78.111 266.158 15,468 5,000 8,881 3.200 387 13,804 382 1,928 1.452 840 1.452 430.148 489,371 576,149 597,313 24.058 25,459 29,089 33.798 91.483 109,299 127,432 152.843 314.807 354.01410.827410 874 18.884 42,410 51,870 56,880 1,00D 900 3,300 4.450 0 382322 322 14.173 27.840 34.339 39.033 3.000 1,978 851 13.289 13.909 11.098 14.446 17,423 18,664 22.243 243205302228 1.824 1.037 1.857 1.028 1.492 2.8591 888 1.728 842 0 2.857 1.508 1.980 2 .454 2458 1.454 1 .630 1.540 1.711 238 250 262 279 7.601 8 ,531 11,583 11.058 514.564 606.268 710.329 745.941 142 6,775 436.756 Deposits Demand deposits Savings deposit Term deposits/fixed deposits Borrowings Borrowings from Reserve Bank of India Borrowings from other banks Borrowings from other financial institutions Borrowings in the form of bonds/debentures Borrowings from out of India Other Liabilities and Provisions Bills payable Interoffice adjustment liabilities Interest accrued Deferred tax liabilities Provision for standard assets Proposed dividend Corporate dividend tax payable Other liabilities and provisions Total Liabilities APPLICATION OF FUNDS Cash and Balance with Reserve Bank of India Cash with RBI Cash in hand and others Balances with banks and money at call Bank balance and call money in India Bank balance and call money outside India Investments in India Government of India/state government securities Approved securities others Equity shares-corporate Debentures and bonds Subsidiaries and/or joint ventures associates Others (mutual fund units, priority sector deposits, pass-through certificates. certificates of deposit/commercial paper) Advances Bils purchased and discounted Cash credit, overdraft, and loans repayable Term loans Capital work in progress Net block Other assets Authorized for use only by SHERIF SAYED in Corporate Finance at University of New Haven from Aug 28, 2019 to Dec 31, 2019. Use outside these parameters is a copyright violation 23, 189 20.420 2.789 4,045 3820 228 130,546 92.775 29.351 28.024 3.327 8,133 7.138 997 145,377 99.645 24.241 27.425 20.283 22.138 3,9585 ,289 11,084 9,775 9,878 0,890 1.400 2.885 174,025 211.546 115,312 145,751 31,043 25.001 8.042 14.251 5.733 8.518 241.179 158.231 1.790 0.4981 1,270 1.881 | 0.053 2. 170 1.907 004 3,959 2,584 8.017 3,980 1.758 11.381 3.980 28,199 35.824 43,242 51,234 65,850 269,501 319,532 377,560 440,967 434,361 12.187 8.088 18,538 14,939 13.029 139,032 174, 115 216,832 205,154 229,775 118,302 130.431 142 189 180.874 191.558 00024228 2.898 2.898 3.281 3.975 4.023 6677 9 1273 18.098 18.818 20.859 9747925347 T 71099075 8:50 PM Type here to search o E H e x H | 9 | 43% - 0 1x la 10/8/2019 19 55 9817N005_pcs.pdf 9817N005_pcs.pdf x + V D - x 0 file:///C:/Users/SHERIF/Desktop/Corporate%20Finance/Case%202%20Federal%20Bank/9B17N005_pcs.pdf 10 of 10 O - + Fit to page ID Page view AV Read aloud Add notes F Page 10 9B17N005 EXHIBIT 8: RELATIVE VALUATION METRICS FOR COMPARABLE FIRMS, AS OF MARCH 31, 2014 P/B Ratio P/E Ratio 4.9% Bank Name Federal Bank (Private Sector Banks) ICICI Bank 14.8x 2.Ox 1.8x Axis Bank 11.1x 4. 1x 21.3x 33.3x 4.1x HDFC Bank Kotak Bank (Public Sector Banks) State Bank of India Punjab National Bank Canara Bank 1.2x 13.2x 8.3x 0.8x 5.1x 0.5x Note: P/E = price to earnings: P/B = price to book Source: Created by the author with information from "BanksPrivate Sector-Standalone.CNBC TV 18 moneycontrol accessed May 20, 2016, www.moneycontrol.com/stocks/data-bank/standalone/banks-private sector/1/annualname: "Banks-Public Sector-Annual, CNBC TV 18 moneycontrol, accessed May 20, 2016. www.moneycontrol.com/stocks/data- bank/standalone/banks-public-sector/1/annualname. for use only by SHERIF SAYED in Corporate Finance at University of New Haven from Aug 28, 2010 to Dec 31, 2010 Use outside these parameters is a copyright violation. Type here to search horelo e n 42% 40 x T 8:51 PM 10/8/2019 19 55 9817N005_pcs.pdf 9817N005_pcs.pdf x + V D - x 0 file:///C:/Users/SHERIF/Desktop/Corporate%20Finance/Case%202%20Federal%20Bank/9B17N005_pcs.pdf 6 of 10 o - + Fit to page AV Read aloud Add notes F ID Page view 9B17N005 Page 6 EXHIBIT 2: LIST OF BANKS BY CATEGORY State Bank of India and Subsidiaries State Bank of India State Bank of Bikaner & Jaipur State Bank of Hyderabad State Bank of Mysore State Bank of Patiala State Bank of Travancore Old Private Sector Banks Catholic Syrian Bank City Union Bank Dhanlaxmi Bank Federal Bank ING Vysya Bank Jammu & Kashmir Bank Karnataka Bank Karur Vysya Bank Lakshmi Vilas Bank Nainital Bank Ratnakar Bank South Indian Bank Tamilnad Mercantile Bank Nationalized Banks Allahabad Bank Andhra Bank Bank of Baroda Bank of India Bank of Maharashtra Canara Bank Central Bank of India Corporation Bank Dena Bank IDBI Bank Ltd. Indian Bank Indian Overseas Bank Oriental Bank of Commerce Punjab and Sind Bank Punjab National Bank Syndicate Bank UCO Bank Union Bank of India United Bank of India Vijaya Bank New Private Sector Banks Axis Bank Development Credit Bank HDFC Bank ICICI Bank IndusInd Bank Kotak Mahindra Bank Yes Bank Foreign Banks AB Bank Abu Dhabi Commercial Bank American Express Banking Corp. Antwerp Diamond Bank Australia and New Zealand Banking Group Bank Internasional Indonesia Bank of America Bank of Bahrain & Kuwait Bank of Ceylon Bank of Nova Scotia Bank of Tokyo-Mitsubishi UFJ Barclays Bank BNP Paribas Chinatrust Commercial Bank Citibank Commonwealth Bank of Australia Credit Agricole Credit Suisse AG DBS Bank Deutsche Bank FirstRand Bank Hong Kong & Shanghai Banking Corporation HSBC Bank Oman S.A.O.G. Industrial and Commercial Bank of China JP Morgan Chase Bank JSC VTB Bank Krung Thai Bank Mashreqbank Mizuho Corporate Bank National Australia Bank Rabobank International Royal Bank of Scotland Sberbank Shinhan Bank Societe Generale Sonali Bank Standard Chartered Bank State Bank of Mauritius Sumitomo Mitsui Banking only by SHERIF SAYED in Corporate Finance at University of New Haven from Aug 28, 2019 to Dec 31, 2019 Use outside these parameters is a copyright violation 8:43 PM Type here to search 46% - 0 1x la 10/8/2019 19 5 9817N005_pcs.pdf 9817N005_pcs.pdf x + V 0 file:///C:/Users/SHERIF/Desktop/Corporate%20Finance/Case%202%20Federal%20Bank/9B17N005_pcs.pdf 7 of 100 - + Fit to page ID Page view AV Read aloud b Add notes Page 7 9B17N005 EXHIBIT 3: COMMERCIAL BANKS STATISTICS ( BILLIONS) FY Aggregate deposits of scheduled commercial banks in India Bank credit of scheduled commercial banks in India 2008/09 38,341 27,755 2009/10 44,928 32,448 2010/11 52,080 39,421 2011/12 59,091 46,119 2012/13 67,505 52,605 Note: FY = fiscal year, ending March 31st annually Source: Reserve Bank of India, Statistical Tables Relating to Banks in India 2012-13, accessed May 20, 2010, https://rbidocs.rbi.org.in/docs/Publications/PDFs/OSTR101113FL.pdf, XI. EXHIBIT 4: KEY FINANCIAL PARAMETERS OF PUBLIC AND PRIVATE BANKS IN INDIA FY Public Sector Banks Profit per Return Capital Employee on Adequacy (million) Assets Ratio 0.47 1.03 13.49 0.53 0.97 13.27 0.59 0.96 13.08 0.64 0.88 13.23 0.63 0.78 12.38 2008/09 2009/10 2010/11 2011/12 13 0 Net NPA Ratio .94 1.10 1.09 1.53 2.02 porate Finance at University of New Haven from Aug 28, 2019 to Dec 31, 2019 hese parameters is a copyright violation Private Sector Banks Profit per Return Capital | Net Employee on Adequacy NPA 1 million) Assets Ratio Ratio 0.62 | 1.13 15 23 1.29 0.72 1.28 17.43 1.04 0.94 16.46 0.56 0.92 16.21 0.46 1.07 1.63 16.84 0.52 http://dbie.rbi.org.in/DBIE/dbie.rbi?site=publications Note: FY = fiscal year, ending March 31st annually: NPA = non-performing asset Source: "Database on Indian Economy." Reserve Bank of India, accessed June 8, 2014, http://dbie.rbi.org.in/DBIE/dbie.rbi?site=publications. 8:44 PM Type here to search 46% - 0 1x la 10/8/2019 19 55 9817N005_pcs.pdf 9817N005_pcs.pdf x + V 0 file:///C:/Users/SHERIF/Desktop/Corporate%20Finance/Case%202%20Federal%20Bank/9B17N005_pcs.pdf 9 of 10 - + Fit to page ID Page view JDIT NOUS AV Read aloud Add notes F raye EXHIBIT 7: FEDERAL BANK BALANCE SHEET ( MILLION) FY 2009/10 2010/11 2011/12 2012/13 2013/14 SOURCES OF FUNDS Share capital Total reserves 1.710 49,378 1,710 55,353 1,711 81,938 1.711 87,795 1.710 45,194 360,580 18.313 78.111 266.158 15,468 5,000 8,881 3.200 387 13,804 382 1,928 1.452 840 1.452 430.148 489,371 576,149 597,313 24.058 25,459 29,089 33.798 91.483 109,299 127,432 152.843 314.807 354.01410.827410 874 18.884 42,410 51,870 56,880 1,00D 900 3,300 4.450 0 382322 322 14.173 27.840 34.339 39.033 3.000 1,978 851 13.289 13.909 11.098 14.446 17,423 18,664 22.243 243205302228 1.824 1.037 1.857 1.028 1.492 2.8591 888 1.728 842 0 2.857 1.508 1.980 2 .454 2458 1.454 1 .630 1.540 1.711 238 250 262 279 7.601 8 ,531 11,583 11.058 514.564 606.268 710.329 745.941 142 6,775 436.756 Deposits Demand deposits Savings deposit Term deposits/fixed deposits Borrowings Borrowings from Reserve Bank of India Borrowings from other banks Borrowings from other financial institutions Borrowings in the form of bonds/debentures Borrowings from out of India Other Liabilities and Provisions Bills payable Interoffice adjustment liabilities Interest accrued Deferred tax liabilities Provision for standard assets Proposed dividend Corporate dividend tax payable Other liabilities and provisions Total Liabilities APPLICATION OF FUNDS Cash and Balance with Reserve Bank of India Cash with RBI Cash in hand and others Balances with banks and money at call Bank balance and call money in India Bank balance and call money outside India Investments in India Government of India/state government securities Approved securities others Equity shares-corporate Debentures and bonds Subsidiaries and/or joint ventures associates Others (mutual fund units, priority sector deposits, pass-through certificates. certificates of deposit/commercial paper) Advances Bils purchased and discounted Cash credit, overdraft, and loans repayable Term loans Capital work in progress Net block Other assets Authorized for use only by SHERIF SAYED in Corporate Finance at University of New Haven from Aug 28, 2019 to Dec 31, 2019. Use outside these parameters is a copyright violation 23, 189 20.420 2.789 4,045 3820 228 130,546 92.775 29.351 28.024 3.327 8,133 7.138 997 145,377 99.645 24.241 27.425 20.283 22.138 3,9585 ,289 11,084 9,775 9,878 0,890 1.400 2.885 174,025 211.546 115,312 145,751 31,043 25.001 8.042 14.251 5.733 8.518 241.179 158.231 1.790 0.4981 1,270 1.881 | 0.053 2. 170 1.907 004 3,959 2,584 8.017 3,980 1.758 11.381 3.980 28,199 35.824 43,242 51,234 65,850 269,501 319,532 377,560 440,967 434,361 12.187 8.088 18,538 14,939 13.029 139,032 174, 115 216,832 205,154 229,775 118,302 130.431 142 189 180.874 191.558 00024228 2.898 2.898 3.281 3.975 4.023 6677 9 1273 18.098 18.818 20.859 9747925347 T 71099075 8:50 PM Type here to search o E H e x H | 9 | 43% - 0 1x la 10/8/2019 19 55 9817N005_pcs.pdf 9817N005_pcs.pdf x + V D - x 0 file:///C:/Users/SHERIF/Desktop/Corporate%20Finance/Case%202%20Federal%20Bank/9B17N005_pcs.pdf 10 of 10 O - + Fit to page ID Page view AV Read aloud Add notes F Page 10 9B17N005 EXHIBIT 8: RELATIVE VALUATION METRICS FOR COMPARABLE FIRMS, AS OF MARCH 31, 2014 P/B Ratio P/E Ratio 4.9% Bank Name Federal Bank (Private Sector Banks) ICICI Bank 14.8x 2.Ox 1.8x Axis Bank 11.1x 4. 1x 21.3x 33.3x 4.1x HDFC Bank Kotak Bank (Public Sector Banks) State Bank of India Punjab National Bank Canara Bank 1.2x 13.2x 8.3x 0.8x 5.1x 0.5x Note: P/E = price to earnings: P/B = price to book Source: Created by the author with information from "BanksPrivate Sector-Standalone.CNBC TV 18 moneycontrol accessed May 20, 2016, www.moneycontrol.com/stocks/data-bank/standalone/banks-private sector/1/annualname: "Banks-Public Sector-Annual, CNBC TV 18 moneycontrol, accessed May 20, 2016. www.moneycontrol.com/stocks/data- bank/standalone/banks-public-sector/1/annualname. for use only by SHERIF SAYED in Corporate Finance at University of New Haven from Aug 28, 2010 to Dec 31, 2010 Use outside these parameters is a copyright violation. Type here to search horelo e n 42% 40 x T 8:51 PM 10/8/2019 19


