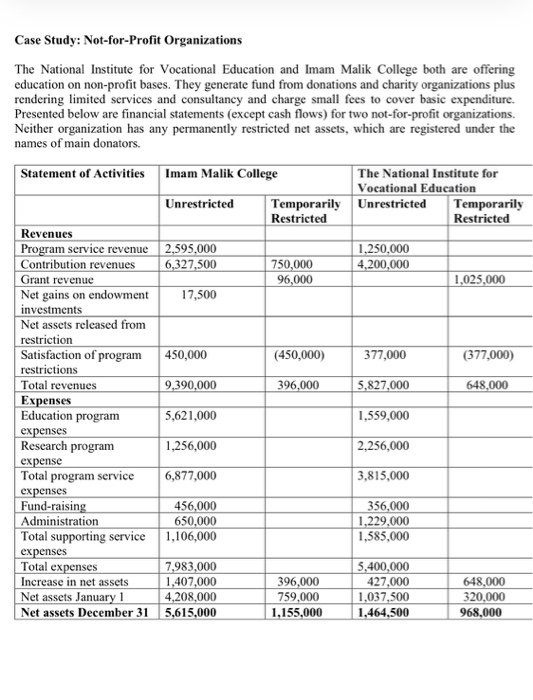
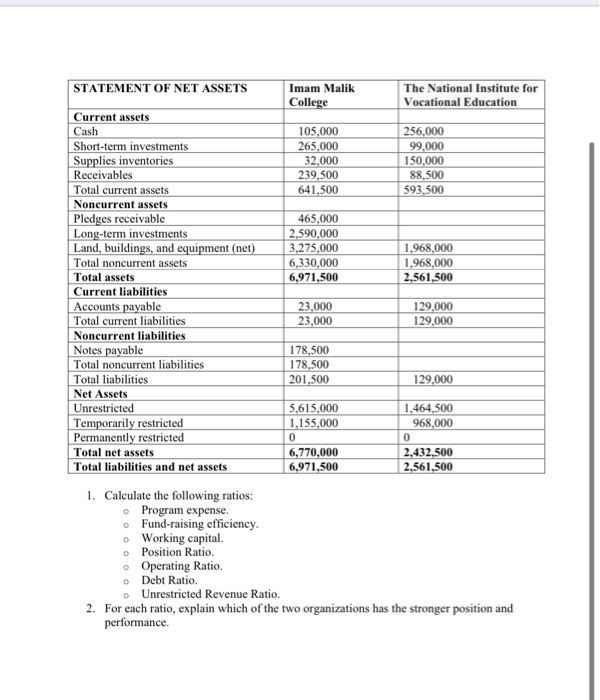
Case Study: Not-for-Profit Organizations The National Institute for Vocational Education and Imam Malik College both are offering education on non-profit bases. They generate fund from donations and charity organizations plus rendering limited services and consultancy and charge small fees to cover basic expenditure. Presented below are financial statements (except cash flows) for two not-for-profit organizations Neither organization has any permanently restricted net assets, which are registered under the names of main donators. Statement of Activities Imam Malik College The National Institute for Vocational Education Unrestricted Temporarily Restricted Unrestricted Temporarily Restricted 2,595,000 6,327,500 | 1.250.000 4.200,000 750.000 96,000 1,025,000 17,500 450,000 (450,000) 377,000 (377,000) 9,390,000 396,000 5,827,000 648.000 5,621,000 1,559,000 Revenues Program service revenue Contribution revenues Grant revenue Net gains on endowment investments Net assets released from restriction Satisfaction of program restrictions Total revenues Expenses Education program expenses Research program expense Total program service expenses Fund-raising Administration Total supporting service expenses Total expenses Increase in net assets Net assets January 1 4 Net assets December 31 1,256,000 2,256,000 6,877,000 3,815,000 456,000 650,000 1.106.000 356,000 1,229,000 1,585,000 7,983,000 1,407,000 .208.000 5.615,000 396,000 759.000 1,155.000 5,400,000 427,000 1,037,500 1,464,500 648,000 320,000 968,000 STATEMENT OF NET ASSETS Imam Malik College The National Institute for Vocational Education 105,000 265,000 32.000 239,500 641,500 256,000 99,000 150.000 88,500 593,500 465,000 2,590,000 3,275,000 6,330,000 6,971,500 1,968,000 1.968,000 2,561,500 Current assets Cash Short-term investments Supplies inventories Receivables Total current assets Noncurrent assets Pledges receivable Long-term investments Land, buildings, and equipment (net) Total noncurrent assets Total assets Current liabilities Accounts payable Total current liabilities Noncurrent liabilities Notes payable Total noncurrent liabilities Total liabilities Net Assets Unrestricted Temporarily restricted Permanently restricted Total net assets Total liabilities and net assets 23,000 23.000 129.000 129.000 I 178.500 178,500 201,500 129.000 5,615,000 1,155,000 1,464,500 968,000 10 2,432,500 2,561,500 6,770,000 6,971,500 1. Calculate the following ratios: Program expense. Fund-raising efficiency. o Working capital. Position Ratio. Operating Ratio. o Debt Ratio Unrestricted Revenue Ratio. 2. For each ratio, explain which of the two organizations has the stronger position and performance


