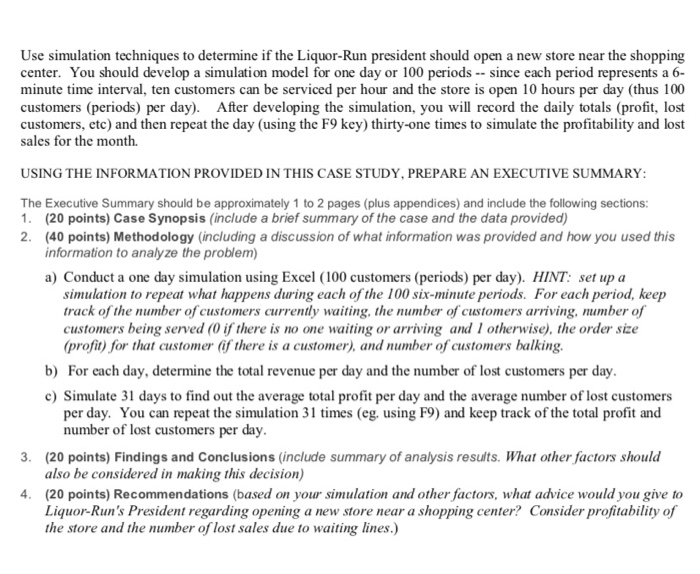
CASE STUDY: Simulation LIQUOR-RUN For this assignment, you will analyze a case study, develop a simulation model in Excel and prepare a short crece report plus appendices) that discusses the conditions of the case and your recommendations Liquor Run, Inc. is a chain of beverage supply stores located throughout Northern California. The stores are designed to enable customers to pick-up beverages, snacks, and party supplies without getting out of their cars A typical store design is shown in the Figure below. A service lane runs through the middle of the store and soft drinks, liquor, beer, and other supplies are stored at various locations along both sides of the service lane When a customer drives into the store, the store clerk takes the order, fills the order, and collects the money. The customer remains in the car when receiving the service. When additional customers arrive at the store they wait in a line outside the store until the preceding customer's order is complete. Then the next customer in line drives into the store for service. Service Entre Sendice Les Waiting Area Liquor-Run's President is considering opening a new store near a shopping center and has requested planning information on the projected operation of the store, including profitability of the store, and the potential number of lost sales due to waiting lines. The fixed costs for the new store including rent, salaries, and overhead comes to S1250 per day In modeling the system we will study the store's operation in terms of what happens during time periods of 6 minutes each. That is, we will count the number of customer arrivals, count the number of customers lost, and determine whether or not a customer is being serviced during each 6-minute interval. We assume that the average time to fill cach order is 6 minutes Based on a study of traffic flow, the company has estimated that the probability distribution of customer arrivals is as shown in Table 1. As the table shows, there is a 0.31 probability of no customers arriving during a given 6-minute interval, a 0.39 probability of one customer, and so on. Number of Customer Arriving Probability 0.31 0.19 002 Sales records from the company's other stores show that customers vary in terms of the size of the order placed. The revenue generated by cach customer is normally distributed with a mean of S14 and a standard deviation of S4. As an additional operation condition, experience with other company stores indicates that customers will wait for service only if there are less than four cars in the waiting line. If a customer arrives and there are already four cars in the waiting are the customer will drive off. This failure to enter the waiting line is referred to as balking and results in a lost customer and a lost profit. Use simulation techniques to determine if the Liquor-Run president should open a new store near the shopping center. You should develop a simulation model for one day or 100 periods -- since each period represents a 6- minute time interval, ten customers can be serviced per hour and the store is open 10 hours per day (thus 100 customers (periods) per day). After developing the simulation, you will record the daily totals (profit, lost customers, etc) and then repeat the day (using the F9 key) thirty-one times to simulate the profitability and lost sales for the month. USING THE INFORMATION PROVIDED IN THIS CASE STUDY, PREPARE AN EXECUTIVE SUMMARY: The Executive Summary should be approximately 1 to 2 pages (plus appendices) and include the following sections: 1. (20 points) Case Synopsis (include a brief summary of the case and the data provided) 2. (40 points) Methodology (including a discussion of what information was provided and how you used this information to analyze the problem) a) Conduct a one day simulation using Excel (100 customers (periods) per day). HINT: set up a simulation to repeat what happens during each of the 100 six-minute periods. For each period, keep track of the number of customers currently waiting, the number of customers arriving, number of customers being served (0 if there is no one waiting or arriving and 1 otherwise), the order size (profit for that customer if there is a customer), and number of customers balking b) For each day, determine the total revenue per day and the number of lost customers per day. c) Simulate 31 days to find out the average total profit per day and the average number of lost customers per day. You can repeat the simulation 31 times (eg, using F9) and keep track of the total profit and number of lost customers per day. 3. (20 points) Findings and Conclusions (include summary of analysis results. What other factors should also be considered in making this decision) 4. (20 points) Recommendations (based on your simulation and other factors, what advice would you give to Liquor-Run's President regarding opening a new store near a shopping center? Consider profitability of the store and the number of lost sales due to waiting lines.) CASE STUDY: Simulation LIQUOR-RUN For this assignment, you will analyze a case study, develop a simulation model in Excel and prepare a short crece report plus appendices) that discusses the conditions of the case and your recommendations Liquor Run, Inc. is a chain of beverage supply stores located throughout Northern California. The stores are designed to enable customers to pick-up beverages, snacks, and party supplies without getting out of their cars A typical store design is shown in the Figure below. A service lane runs through the middle of the store and soft drinks, liquor, beer, and other supplies are stored at various locations along both sides of the service lane When a customer drives into the store, the store clerk takes the order, fills the order, and collects the money. The customer remains in the car when receiving the service. When additional customers arrive at the store they wait in a line outside the store until the preceding customer's order is complete. Then the next customer in line drives into the store for service. Service Entre Sendice Les Waiting Area Liquor-Run's President is considering opening a new store near a shopping center and has requested planning information on the projected operation of the store, including profitability of the store, and the potential number of lost sales due to waiting lines. The fixed costs for the new store including rent, salaries, and overhead comes to S1250 per day In modeling the system we will study the store's operation in terms of what happens during time periods of 6 minutes each. That is, we will count the number of customer arrivals, count the number of customers lost, and determine whether or not a customer is being serviced during each 6-minute interval. We assume that the average time to fill cach order is 6 minutes Based on a study of traffic flow, the company has estimated that the probability distribution of customer arrivals is as shown in Table 1. As the table shows, there is a 0.31 probability of no customers arriving during a given 6-minute interval, a 0.39 probability of one customer, and so on. Number of Customer Arriving Probability 0.31 0.19 002 Sales records from the company's other stores show that customers vary in terms of the size of the order placed. The revenue generated by cach customer is normally distributed with a mean of S14 and a standard deviation of S4. As an additional operation condition, experience with other company stores indicates that customers will wait for service only if there are less than four cars in the waiting line. If a customer arrives and there are already four cars in the waiting are the customer will drive off. This failure to enter the waiting line is referred to as balking and results in a lost customer and a lost profit. Use simulation techniques to determine if the Liquor-Run president should open a new store near the shopping center. You should develop a simulation model for one day or 100 periods -- since each period represents a 6- minute time interval, ten customers can be serviced per hour and the store is open 10 hours per day (thus 100 customers (periods) per day). After developing the simulation, you will record the daily totals (profit, lost customers, etc) and then repeat the day (using the F9 key) thirty-one times to simulate the profitability and lost sales for the month. USING THE INFORMATION PROVIDED IN THIS CASE STUDY, PREPARE AN EXECUTIVE SUMMARY: The Executive Summary should be approximately 1 to 2 pages (plus appendices) and include the following sections: 1. (20 points) Case Synopsis (include a brief summary of the case and the data provided) 2. (40 points) Methodology (including a discussion of what information was provided and how you used this information to analyze the problem) a) Conduct a one day simulation using Excel (100 customers (periods) per day). HINT: set up a simulation to repeat what happens during each of the 100 six-minute periods. For each period, keep track of the number of customers currently waiting, the number of customers arriving, number of customers being served (0 if there is no one waiting or arriving and 1 otherwise), the order size (profit for that customer if there is a customer), and number of customers balking b) For each day, determine the total revenue per day and the number of lost customers per day. c) Simulate 31 days to find out the average total profit per day and the average number of lost customers per day. You can repeat the simulation 31 times (eg, using F9) and keep track of the total profit and number of lost customers per day. 3. (20 points) Findings and Conclusions (include summary of analysis results. What other factors should also be considered in making this decision) 4. (20 points) Recommendations (based on your simulation and other factors, what advice would you give to Liquor-Run's President regarding opening a new store near a shopping center? Consider profitability of the store and the number of lost sales due to waiting lines.)