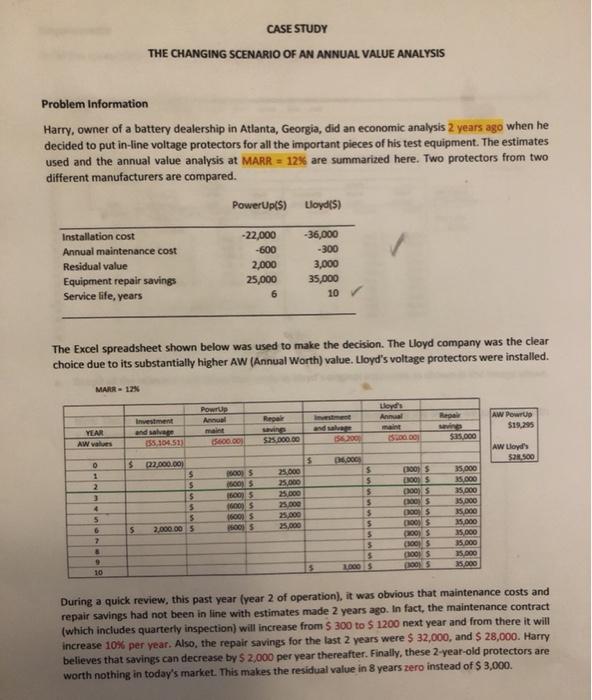
CASE STUDY THE CHANGING SCENARIO OF AN ANNUAL VALUE ANALYSIS Problem Information Harry, owner of a battery dealership in Atlanta, Georgia, did an economic analysis 2 years ago when he decided to put in-line voltage protectors for all the important pieces of his test equipment. The estimates used and the annual value analysis at MARR = 12% are summarized here. Two protectors from two different manufacturers are compared. PowerUp() Lloyd (5) Installation cost Annual maintenance cost Residual value Equipment repair savings Service life. years -22,000 -600 2,000 25,000 6 -36,000 -300 3,000 35,000 10 The Excel spreadsheet shown below was used to make the decision. The Lloyd company was the clear choice due to its substantially higher AW (Annual Worth) value. Lloyd's voltage protectors were installed. MARR - 12% Lloyd's Powerp Awal Real AW Powrup $19.95 YEAR AW vahes Investment and sa 055104511 and are 156200 525.000.00 $35.000 5.600.00 AW Lloyd's $2.500 $ 22.000.00 $ $ $ 25.000 25,000 35. DOO 35,000 35.000 35.000 000 $ 600 S MOO 5 16005 16001S MOS 25.000 35.000 5 2.000.00 5 3 4 5 6 2 8 9 10 $ $ 5 $ $ 5 5 5 5 10005 000 $ 1001 000) 000 $ DOS 100S 2005 (100 MOS 35.000 35.000 35.000 15.000 5.000 During a quick review, this past year (year 2 of operation), it was obvious that maintenance costs and repair savings had not been in line with estimates made 2 years ago. In fact, the maintenance contract (which includes quarterly inspection) will increase from $ 300 to $ 1200 next year and from there it will increase 10% per year. Also, the repair savings for the last 2 years were $ 32,000, and $ 28,000. Harry believes that savings can decrease by $ 2,000 per year thereafter. Finally, these 2-year-old protectors are worth nothing in today's market. This makes the residual value in 8 years zero instead of $3,000 CASE STUDY THE CHANGING SCENARIO OF AN ANNUAL VALUE ANALYSIS Problem Information Harry, owner of a battery dealership in Atlanta, Georgia, did an economic analysis 2 years ago when he decided to put in-line voltage protectors for all the important pieces of his test equipment. The estimates used and the annual value analysis at MARR = 12% are summarized here. Two protectors from two different manufacturers are compared. PowerUp() Lloyd (5) Installation cost Annual maintenance cost Residual value Equipment repair savings Service life. years -22,000 -600 2,000 25,000 6 -36,000 -300 3,000 35,000 10 The Excel spreadsheet shown below was used to make the decision. The Lloyd company was the clear choice due to its substantially higher AW (Annual Worth) value. Lloyd's voltage protectors were installed. MARR - 12% Lloyd's Powerp Awal Real AW Powrup $19.95 YEAR AW vahes Investment and sa 055104511 and are 156200 525.000.00 $35.000 5.600.00 AW Lloyd's $2.500 $ 22.000.00 $ $ $ 25.000 25,000 35. DOO 35,000 35.000 35.000 000 $ 600 S MOO 5 16005 16001S MOS 25.000 35.000 5 2.000.00 5 3 4 5 6 2 8 9 10 $ $ 5 $ $ 5 5 5 5 10005 000 $ 1001 000) 000 $ DOS 100S 2005 (100 MOS 35.000 35.000 35.000 15.000 5.000 During a quick review, this past year (year 2 of operation), it was obvious that maintenance costs and repair savings had not been in line with estimates made 2 years ago. In fact, the maintenance contract (which includes quarterly inspection) will increase from $ 300 to $ 1200 next year and from there it will increase 10% per year. Also, the repair savings for the last 2 years were $ 32,000, and $ 28,000. Harry believes that savings can decrease by $ 2,000 per year thereafter. Finally, these 2-year-old protectors are worth nothing in today's market. This makes the residual value in 8 years zero instead of $3,000


