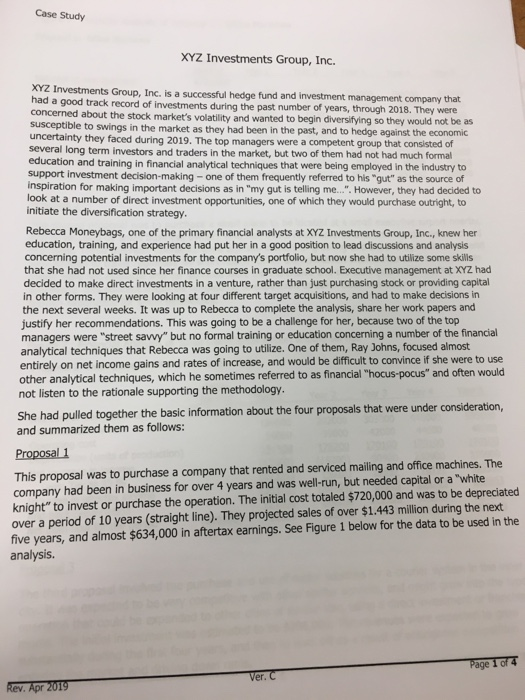
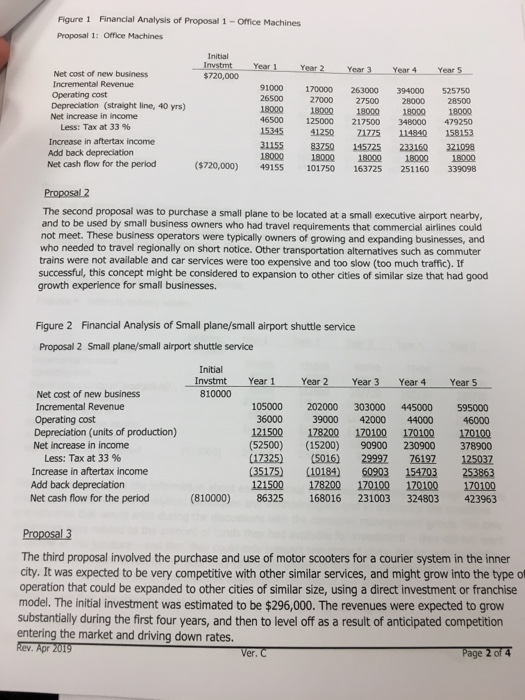
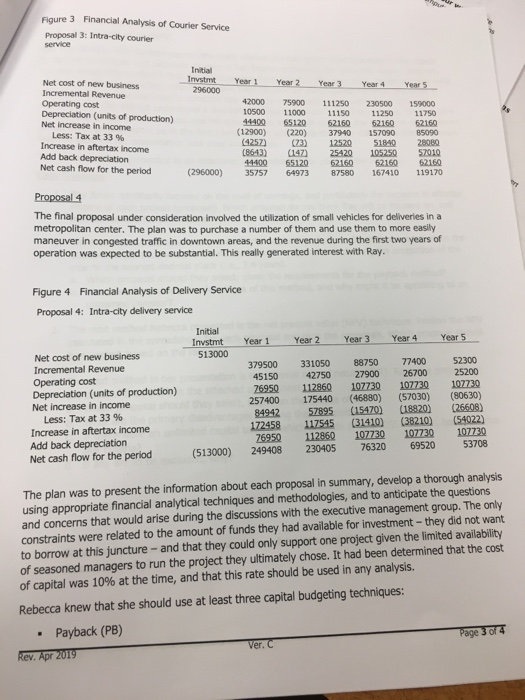
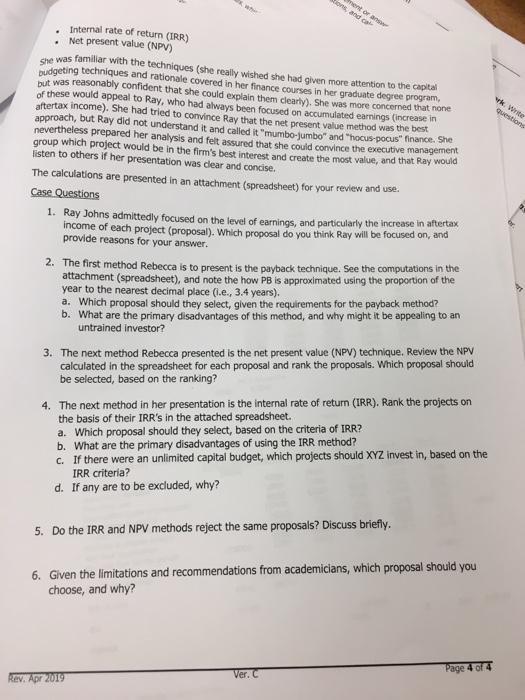
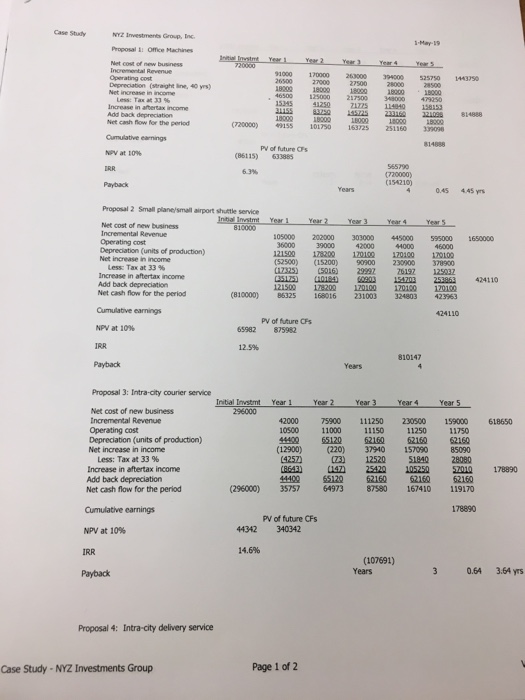
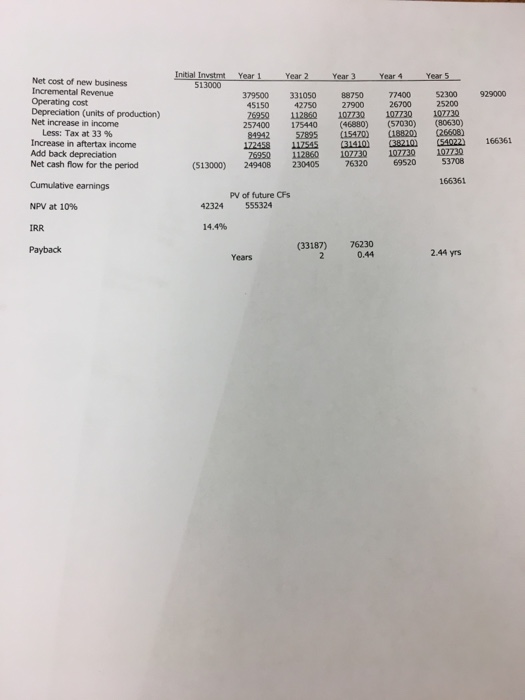
Case Study XYZ Investments Group, Inc. XYZ Investments Group, Inc. is a successful hedge fund and investment management company that had a good track record of investments during the past number of years, through 2018. They were concerned about the stock market's volatility and wanted to begin diversifying so they would not be as susceptible to swings in the market as they had been in the past, and to hedge against the economic uncertainty they faced during 2019. The top managers were a competent group that consisted of several long term investors and traders in the market, but two of them had not had much formal education and training in financial analytical techniques that were being employed in the industry to support investment decision-making - one of them frequently referred to his "gut" as the source of inspiration for making important decisions as in "my gut is telling me.... However, they had decided to look at a number of direct investment opportunities, one of which they would purchase outright, to initiate the diversification strategy. Rebecca Moneybags, one of the primary financial analysts at XYZ Investments Group, Inc.,.knew her education, training, and experience had put her in a good position to lead discussions and analysis concerning potential investments for the company's portfolio, but now she had to utilize some skills that she had not used since her finance courses in graduate school. Executive management at XYZ had decided to make direct investments in a venture, rather than just purchasing stock or providing capital in other forms. They were looking at four different target acquisitions, and had to make decisions in the next several weeks. It was up to Rebecca to complete the analysis, share her work papers and justify her recommendations. This was going to be a challenge for her, because two of the top managers were "street savwy" but no formal training or education concerning a number of the financial analytical techniques that Rebecca was going to utilize. One of them, Ray Johns, focused almost entirely on net income gains and rates of increase, and would be difficult to convince if she were to use other analytical techniques, which he sometimes referred to as financial "hocus-pocus" and often would not listen to the rationale supporting the methodology She had pulled together the basic information about the four proposals that were under consideration, and summarized them as follows: Proposal 1 This proposal was to purchase a company that rented and serviced mailing and office machines. The company had been in business for over 4 years and was well-run, but needed capital or a "white knight" to invest or purchase the operation. The initial cost totaled $720,000 and was to be depreciated over a period of 10 years (straight line). They projected sales of over $1.443 million during the next five years, and almost $634,000 in aftertax earnings. See Figure 1 below for the data to be used in the analysis. age Ver. C Figure 1 Financial Analysis of Proposal 1 -Office Machines Proposal 1: Office Machines Initial Net cost of new business $720,000 91000 170000 263000 394000 525 26500 Operating cost 27000 27500 28 28500 18000 18000 18000 18000 Depreciation (straight line, 40 yrs) Net increase in income 46500 125000 217500 348000 479250 15345 41250 71775 114840 158153 31155 83750 145725 233160 321098 Less: Tax at 33 % Increase in aftertax income Add back depreciation Net cash flow for the period 18000 18000 18000 1800 18000 ($720,000) 49155 10170 163725 251160 339098 The second proposal was to purchase a small plane to be located at a small executive airport nearby, and to be used by small business owners who had travel requirements that commercial airlines could not meet. These business operators were typically owners of growing and expanding businesses, and who needed to travel regionally on short notice. Other transportation alternatives such as commuter trains were not available and car services were too expensive and too slow (too much traffic). If successful, this concept might be considered to expansion to other cities of similar size that had good growth experience for small businesses. Figure 2 Financial Analysis of Small plane/small airport shuttle service Proposal 2 Small plane/small airport shuttle service Initial InvstmtYear 1 Year 2 Year 3 Year 4Year 5 Net cost of new business Incremental Revenue Operating cost Depreciation (units of production) Net increase in income 810000 105000 202000 303000 445000 595000 36000 39000 42000 44000 46000 121500 178200 170100 170100 170100 (52500) (15200) 90900 230900 378900 (17325) (5016) 29997 76192 125037 (35175) (10184) 60903 154703 253863 121500 178200 170100 170100 170100 (810000) 86325 168016 231003 324803423963 Less: Tax at 33 % Increase in aftertax income Add back depreciation Net cash flow for the period The third proposal involved the purchase and use of motor scooters for a courier system in the inner city. It was expected to be very competitive with other similar services, and might grow into the type of operation that could be expanded to other cities of similar size, using a direct investment or franchise model. The initial investment was estimated to be $296,000. The revenues were expected to grow substantially during the first four years, and then to level off as a result of anticipated competition entering the market and driving down rates. er age Figure 3 Financial Analysis of Courier Service Proposal 3: Intra-cily courier service Initial Net cost of new business Incremental Revenue Operating cost Depreciation (units of production) Net increase in income 296000 42000 75900 111250 230500 159000 10500 11000 11150 11250 11750 14400 65120 62160 62160 62160 12900) (220) 37940 157090 85090 (4257) 3 12520 51840 28080 (8643) (147) 25420 105250 2010 44400 65120 62160 62160 62160 Less: Tax at 33 % Increase in aftertax income Add back depreciation Net cash flow for the period (296000) 35757 64973 87580 167410 119170 Proposa 4 The final proposal under consideration involved the utilization of small vehicles for deliveries in a metropolitan center. The plan was to purchase a number of them and use them to more easily maneuver in congested traffic in downtown areas, and the revenue during the first two years of operation was expected to be substantial. This really generated interest with Ray. Figure 4 Financial Analysis of Delivery Service Proposal 4: Intra-city delivery service Initial nstmt Year 1 Year 2 Year 3 Year 4 Year 5 513000 Net cost of new business 379500 331050 88750 77400 2300 45150 42750 27900 26700 25200 26950 112860 107730 107730 107730 257400 175440 (46880) (57030) (80630) 84942 57895 (15470) (18820) (26608) 172458 117545 (31410) (38210) (54022) 76950 112860 107730 107730 107730 Incremental Revenue Operating cost Depreciation (units of production) Net increase in income Less: Tax at 33 % Increase in aftertax income Add back depreciation (513000) 249408 230405 76320 69520 53708 Net cash flow for the period The plan was to present the information about each proposal in summary, develop a thorough analysis using appropriate financial analytical techniques and methodologies, and to anticipate the questions and concerns that would arise during the discussions with the executive management group. The only constraints were related to the amount of funds they had available for investment-they did not want to borrow at this juncture- and that they could only support one project given the limited availability of seasoned managers to run the project they ultimately chose. It had been determined that the cost of capital was 10% at the time, and that this rate should be used in any analysis. Rebecca knew that she should use at least three capital budgeting techniques .Payback (PB) age er Internal rate of return (IRR) Net present value (NPV) was familiar with the techniques (she really wished she had given more attention to the capita Sudgeting techniques and rationale covered in her finance courses in her graduate degree program but was reasonably confident that she could explain them clearly). She was more concerned that none of these would appeal to Ray, who had always been focused on accumulated earnings (increase in aftertax income). She had tried to convince Ray that the approach, but Ray did not understand it and called it "mumbo-jumbo" and " nevertheless prepared her analysis and felt assured that she could convince the group which project would be in the firm's best interest and create the most value, and that Ray would listen to others if her presentation was clear and concise. net present value method was the best "hocus-pocus" finance. She The calculations are presented in an attachment (spreadsheet) for your review and use. Ray Johns admittedly focused on the level of earnings, and particularly the increase in afte income of each project (proposal). Which proposal do you think Ray will be focused on provide reasons for your answer. 1. first method Rebecca is to present is the payback technique. See the computations in the attachment (spreadsheet), and note the how PB is approximated using the proportion of the year to the nearest decimal place (i.e., 3.4 years). a. Which proposal should they select, given the requirements for the payback method? b. What are the primary disadvantages of this method, and why might it be appealing to an untrained investor? 3. The next method Rebecca presented is the net present value (NPV) technique. Review the NPV calculated in the spreadsheet for each proposal and rank the proposals. Which proposal should be selected, based on the ranking? The next method in her presentation is the internal rate of return (IRR). Rank the projects on the basis of their IRR's in the attached spreadsheet. a. Which proposal should they select, based on the criteria of IRR? b. What are the primary disadvantages of using the IRR method? c. If there were an unlimited capital budget, which projects should XYZ invest in, based on the 4. IRR criteria? d. If any are to be excluded, why? 5. Do the IRR and NPV methods reject the same proposals? Discuss briefly. Given the limitations and recommendations from choose, and why? academicians, which proposal should you 6. er Case StutyNYZ Investments Group,n Proposal i Office Machines new business 91000 170000 20000 394000 525750 1403750 Depreciation (straight ine, 40 yrs) 18202 18000 18000 182008000 46500 125000 217500 15345 41250 Z1725 114940 18453 31155 3 5725233 0 814888 10002 10 18000 348000 4795so back depreciation Net cash flow for the period Cumulative earnings NPV at 10% IRR Payback 7200005 10150 163725 251160339098 (86115) 633885 (720000) 4 0.45 445 yrs Proposal 2 Small plane/small airport shuttle service Net cost of new business Incremental Revenue Operating cost Depreciation (units of production) 105000 202000 303000 445000 595000 1650000 121500 128200 1701 170100 120100 (52500 (15200) 90900 230900 30900 17325 (5016) 2999 619125032 Less: Tax at 33 % Increase in aftertax income Add back depreciation Net cash flow for the period 121502 17820012000 120100 10100 (810000) 86325 168016 231003 324803 423963 Cumulative earnings NPV at 10% IRR Payback PV of future CFs 65982 875982 Years Proposal 3: Intra-city courier service Iritial Invstmt Year 1Year2 Year 3 Year 4 Year 5 Net cost of new business Incremental Revenue Operating cost Depreciation (units of production) Net increase in income 42000 75900 111250 230500 159000 618650 10500 11000 11150 11250 11750 44402 65120 62160 62160 62160 12900) (220) 37940 157090 85090 Less: Tax at 33 % Increase in aftertax income Add back depreciation Net cash flow for the period 73) 12520 51840 28080 H00120 160 52160 52160 (296000) 35757 64973 8780 167410 119170 Cumulative earnings NPV at 10% IRR PV of future CFs 44342 340342 14.6% (107691) Years 3 0.64 3.64 yrs Payback Proposal 4: Intra-city delivery service Page 1 of 2 Case Study-NYZ Investments Group Year Year 3 Year 4 Year 5 Net cost of new business Incremental Reverue Operating cost Depreciation (units of production) Net increase in income 379500 331050 88750 77400 52300 929000 26950 112860 107730 107730 107730 257400 175440 (46880) (57030) (80630) Less: Tax at 33 % Increase in aftertax income Add back depreciation Net cash flow for the period 84942 57895 (15470) (18820) 26608) 172458 117545 (31410) 38210) (54022)166361 26950 112860 107730 107730 197730 76320 53708 69520 (13000) 249408230405 Cumulative earnings PV of future CFs 555324 NPV at 10% 42324 14.4% (33187) 76230 0.44 Payback 2.44 yrs Years Case Study XYZ Investments Group, Inc. XYZ Investments Group, Inc. is a successful hedge fund and investment management company that had a good track record of investments during the past number of years, through 2018. They were concerned about the stock market's volatility and wanted to begin diversifying so they would not be as susceptible to swings in the market as they had been in the past, and to hedge against the economic uncertainty they faced during 2019. The top managers were a competent group that consisted of several long term investors and traders in the market, but two of them had not had much formal education and training in financial analytical techniques that were being employed in the industry to support investment decision-making - one of them frequently referred to his "gut" as the source of inspiration for making important decisions as in "my gut is telling me.... However, they had decided to look at a number of direct investment opportunities, one of which they would purchase outright, to initiate the diversification strategy. Rebecca Moneybags, one of the primary financial analysts at XYZ Investments Group, Inc.,.knew her education, training, and experience had put her in a good position to lead discussions and analysis concerning potential investments for the company's portfolio, but now she had to utilize some skills that she had not used since her finance courses in graduate school. Executive management at XYZ had decided to make direct investments in a venture, rather than just purchasing stock or providing capital in other forms. They were looking at four different target acquisitions, and had to make decisions in the next several weeks. It was up to Rebecca to complete the analysis, share her work papers and justify her recommendations. This was going to be a challenge for her, because two of the top managers were "street savwy" but no formal training or education concerning a number of the financial analytical techniques that Rebecca was going to utilize. One of them, Ray Johns, focused almost entirely on net income gains and rates of increase, and would be difficult to convince if she were to use other analytical techniques, which he sometimes referred to as financial "hocus-pocus" and often would not listen to the rationale supporting the methodology She had pulled together the basic information about the four proposals that were under consideration, and summarized them as follows: Proposal 1 This proposal was to purchase a company that rented and serviced mailing and office machines. The company had been in business for over 4 years and was well-run, but needed capital or a "white knight" to invest or purchase the operation. The initial cost totaled $720,000 and was to be depreciated over a period of 10 years (straight line). They projected sales of over $1.443 million during the next five years, and almost $634,000 in aftertax earnings. See Figure 1 below for the data to be used in the analysis. age Ver. C Figure 1 Financial Analysis of Proposal 1 -Office Machines Proposal 1: Office Machines Initial Net cost of new business $720,000 91000 170000 263000 394000 525 26500 Operating cost 27000 27500 28 28500 18000 18000 18000 18000 Depreciation (straight line, 40 yrs) Net increase in income 46500 125000 217500 348000 479250 15345 41250 71775 114840 158153 31155 83750 145725 233160 321098 Less: Tax at 33 % Increase in aftertax income Add back depreciation Net cash flow for the period 18000 18000 18000 1800 18000 ($720,000) 49155 10170 163725 251160 339098 The second proposal was to purchase a small plane to be located at a small executive airport nearby, and to be used by small business owners who had travel requirements that commercial airlines could not meet. These business operators were typically owners of growing and expanding businesses, and who needed to travel regionally on short notice. Other transportation alternatives such as commuter trains were not available and car services were too expensive and too slow (too much traffic). If successful, this concept might be considered to expansion to other cities of similar size that had good growth experience for small businesses. Figure 2 Financial Analysis of Small plane/small airport shuttle service Proposal 2 Small plane/small airport shuttle service Initial InvstmtYear 1 Year 2 Year 3 Year 4Year 5 Net cost of new business Incremental Revenue Operating cost Depreciation (units of production) Net increase in income 810000 105000 202000 303000 445000 595000 36000 39000 42000 44000 46000 121500 178200 170100 170100 170100 (52500) (15200) 90900 230900 378900 (17325) (5016) 29997 76192 125037 (35175) (10184) 60903 154703 253863 121500 178200 170100 170100 170100 (810000) 86325 168016 231003 324803423963 Less: Tax at 33 % Increase in aftertax income Add back depreciation Net cash flow for the period The third proposal involved the purchase and use of motor scooters for a courier system in the inner city. It was expected to be very competitive with other similar services, and might grow into the type of operation that could be expanded to other cities of similar size, using a direct investment or franchise model. The initial investment was estimated to be $296,000. The revenues were expected to grow substantially during the first four years, and then to level off as a result of anticipated competition entering the market and driving down rates. er age Figure 3 Financial Analysis of Courier Service Proposal 3: Intra-cily courier service Initial Net cost of new business Incremental Revenue Operating cost Depreciation (units of production) Net increase in income 296000 42000 75900 111250 230500 159000 10500 11000 11150 11250 11750 14400 65120 62160 62160 62160 12900) (220) 37940 157090 85090 (4257) 3 12520 51840 28080 (8643) (147) 25420 105250 2010 44400 65120 62160 62160 62160 Less: Tax at 33 % Increase in aftertax income Add back depreciation Net cash flow for the period (296000) 35757 64973 87580 167410 119170 Proposa 4 The final proposal under consideration involved the utilization of small vehicles for deliveries in a metropolitan center. The plan was to purchase a number of them and use them to more easily maneuver in congested traffic in downtown areas, and the revenue during the first two years of operation was expected to be substantial. This really generated interest with Ray. Figure 4 Financial Analysis of Delivery Service Proposal 4: Intra-city delivery service Initial nstmt Year 1 Year 2 Year 3 Year 4 Year 5 513000 Net cost of new business 379500 331050 88750 77400 2300 45150 42750 27900 26700 25200 26950 112860 107730 107730 107730 257400 175440 (46880) (57030) (80630) 84942 57895 (15470) (18820) (26608) 172458 117545 (31410) (38210) (54022) 76950 112860 107730 107730 107730 Incremental Revenue Operating cost Depreciation (units of production) Net increase in income Less: Tax at 33 % Increase in aftertax income Add back depreciation (513000) 249408 230405 76320 69520 53708 Net cash flow for the period The plan was to present the information about each proposal in summary, develop a thorough analysis using appropriate financial analytical techniques and methodologies, and to anticipate the questions and concerns that would arise during the discussions with the executive management group. The only constraints were related to the amount of funds they had available for investment-they did not want to borrow at this juncture- and that they could only support one project given the limited availability of seasoned managers to run the project they ultimately chose. It had been determined that the cost of capital was 10% at the time, and that this rate should be used in any analysis. Rebecca knew that she should use at least three capital budgeting techniques .Payback (PB) age er Internal rate of return (IRR) Net present value (NPV) was familiar with the techniques (she really wished she had given more attention to the capita Sudgeting techniques and rationale covered in her finance courses in her graduate degree program but was reasonably confident that she could explain them clearly). She was more concerned that none of these would appeal to Ray, who had always been focused on accumulated earnings (increase in aftertax income). She had tried to convince Ray that the approach, but Ray did not understand it and called it "mumbo-jumbo" and " nevertheless prepared her analysis and felt assured that she could convince the group which project would be in the firm's best interest and create the most value, and that Ray would listen to others if her presentation was clear and concise. net present value method was the best "hocus-pocus" finance. She The calculations are presented in an attachment (spreadsheet) for your review and use. Ray Johns admittedly focused on the level of earnings, and particularly the increase in afte income of each project (proposal). Which proposal do you think Ray will be focused on provide reasons for your answer. 1. first method Rebecca is to present is the payback technique. See the computations in the attachment (spreadsheet), and note the how PB is approximated using the proportion of the year to the nearest decimal place (i.e., 3.4 years). a. Which proposal should they select, given the requirements for the payback method? b. What are the primary disadvantages of this method, and why might it be appealing to an untrained investor? 3. The next method Rebecca presented is the net present value (NPV) technique. Review the NPV calculated in the spreadsheet for each proposal and rank the proposals. Which proposal should be selected, based on the ranking? The next method in her presentation is the internal rate of return (IRR). Rank the projects on the basis of their IRR's in the attached spreadsheet. a. Which proposal should they select, based on the criteria of IRR? b. What are the primary disadvantages of using the IRR method? c. If there were an unlimited capital budget, which projects should XYZ invest in, based on the 4. IRR criteria? d. If any are to be excluded, why? 5. Do the IRR and NPV methods reject the same proposals? Discuss briefly. Given the limitations and recommendations from choose, and why? academicians, which proposal should you 6. er Case StutyNYZ Investments Group,n Proposal i Office Machines new business 91000 170000 20000 394000 525750 1403750 Depreciation (straight ine, 40 yrs) 18202 18000 18000 182008000 46500 125000 217500 15345 41250 Z1725 114940 18453 31155 3 5725233 0 814888 10002 10 18000 348000 4795so back depreciation Net cash flow for the period Cumulative earnings NPV at 10% IRR Payback 7200005 10150 163725 251160339098 (86115) 633885 (720000) 4 0.45 445 yrs Proposal 2 Small plane/small airport shuttle service Net cost of new business Incremental Revenue Operating cost Depreciation (units of production) 105000 202000 303000 445000 595000 1650000 121500 128200 1701 170100 120100 (52500 (15200) 90900 230900 30900 17325 (5016) 2999 619125032 Less: Tax at 33 % Increase in aftertax income Add back depreciation Net cash flow for the period 121502 17820012000 120100 10100 (810000) 86325 168016 231003 324803 423963 Cumulative earnings NPV at 10% IRR Payback PV of future CFs 65982 875982 Years Proposal 3: Intra-city courier service Iritial Invstmt Year 1Year2 Year 3 Year 4 Year 5 Net cost of new business Incremental Revenue Operating cost Depreciation (units of production) Net increase in income 42000 75900 111250 230500 159000 618650 10500 11000 11150 11250 11750 44402 65120 62160 62160 62160 12900) (220) 37940 157090 85090 Less: Tax at 33 % Increase in aftertax income Add back depreciation Net cash flow for the period 73) 12520 51840 28080 H00120 160 52160 52160 (296000) 35757 64973 8780 167410 119170 Cumulative earnings NPV at 10% IRR PV of future CFs 44342 340342 14.6% (107691) Years 3 0.64 3.64 yrs Payback Proposal 4: Intra-city delivery service Page 1 of 2 Case Study-NYZ Investments Group Year Year 3 Year 4 Year 5 Net cost of new business Incremental Reverue Operating cost Depreciation (units of production) Net increase in income 379500 331050 88750 77400 52300 929000 26950 112860 107730 107730 107730 257400 175440 (46880) (57030) (80630) Less: Tax at 33 % Increase in aftertax income Add back depreciation Net cash flow for the period 84942 57895 (15470) (18820) 26608) 172458 117545 (31410) 38210) (54022)166361 26950 112860 107730 107730 197730 76320 53708 69520 (13000) 249408230405 Cumulative earnings PV of future CFs 555324 NPV at 10% 42324 14.4% (33187) 76230 0.44 Payback 2.44 yrs Years
