Answered step by step
Verified Expert Solution
Question
1 Approved Answer
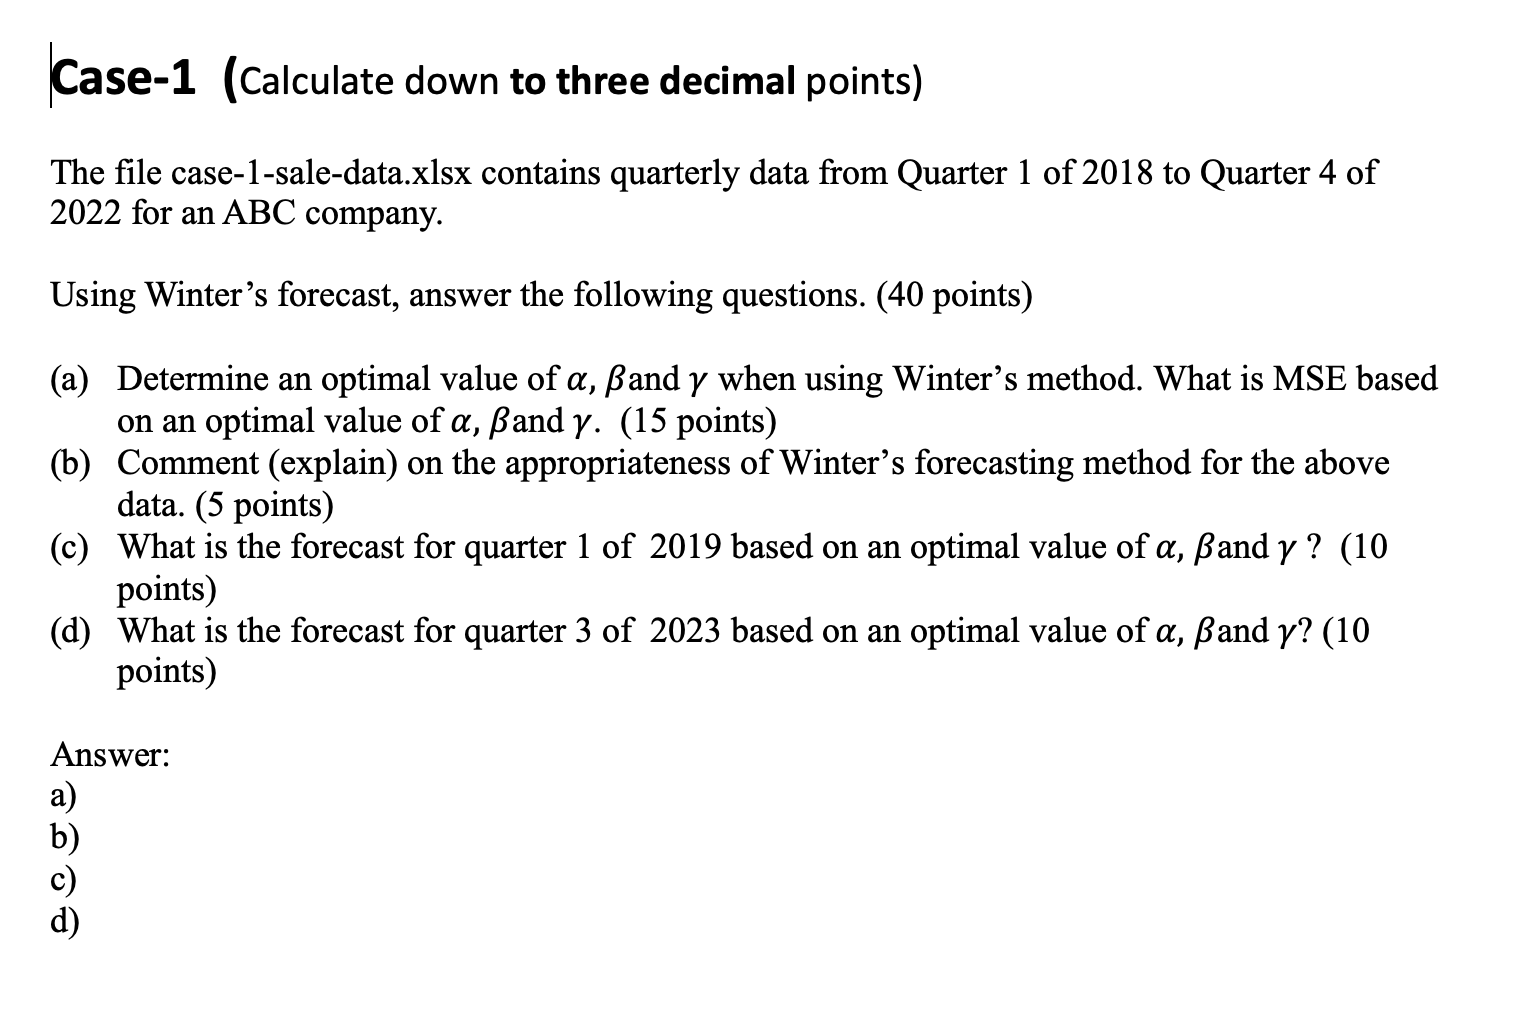
Case-1 (Calculate down to three decimal points) The file case-1-sale-data.xlsx contains quarterly data from Quarter 1 of 2018 to Quarter 4 of 2022 for an

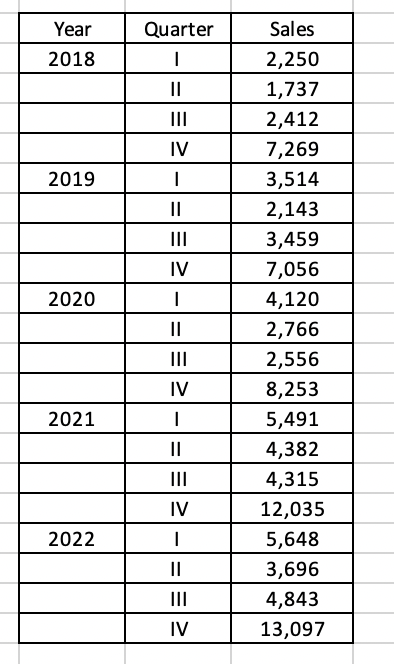
 Case-1 (Calculate down to three decimal points) The file case-1-sale-data.xlsx contains quarterly data from Quarter 1 of 2018 to Quarter 4 of 2022 for an ABC company. Using Winter's forecast, answer the following questions. (40 points) (a) Determine an optimal value of , and when using Winter's method. What is MSE based on an optimal value of , and . (15 points) (b) Comment (explain) on the appropriateness of Winter's forecasting method for the above data. (5 points) (c) What is the forecast for quarter 1 of 2019 based on an optimal value of , and ? (10 points) (d) What is the forecast for quarter 3 of 2023 based on an optimal value of , and ? (10 points) \begin{tabular}{|c|c|c|} \hline Year & Quarter & Sales \\ \hline 2018 & I & 2,250 \\ \hline & II & 1,737 \\ \hline & III & 2,412 \\ \hline & IV & 7,269 \\ \hline 2019 & I & 3,514 \\ \hline & II & 2,143 \\ \hline & III & 3,459 \\ \hline & IV & 7,056 \\ \hline 2020 & I & 4,120 \\ \hline & II & 2,766 \\ \hline & III & 2,556 \\ \hline & IV & 8,253 \\ \hline 2021 & I & 5,491 \\ \hline & II & 4,382 \\ \hline & III & 4,315 \\ \hline & IV & 12,035 \\ \hline 2022 & I & 5,648 \\ \hline & II & 3,696 \\ \hline & III & 4,843 \\ \hline & IV & 13,097 \\ \hline \end{tabular}
 Step by Step Solution
There are 3 Steps involved in it
Step: 1

Get Instant Access to Expert-Tailored Solutions
See step-by-step solutions with expert insights and AI powered tools for academic success
Step: 2

Step: 3

Ace Your Homework with AI
Get the answers you need in no time with our AI-driven, step-by-step assistance
Get Started


