

Question
Cases in Healthcare Finance (6th edition) RIVER COMMUNITY HOSPITAL (B) 1. Financial Forecasting Review the spreadsheet model, paying particular attention to (a) what assumptions are
Cases in Healthcare Finance (6th edition)
RIVER COMMUNITY HOSPITAL (B) 1. Financial Forecasting Review the spreadsheet model, paying particular attention to (a) what assumptions are currently embedded in the model, (b) how the financial forecasts are developed, and (c) how financing feedbacks are handled. Briefly describe the model and its assumptions.
2. Disregard the forecasting results supplied with the model. (a) Use your own assumptions to develop the hospital's forecasted financial statements. Be sure to analyze your results from the perspectives of both accounting consistency and financial feasibility. (b) Use the current industry comparative data given in case 1 to help assess the hospitals projected financial condition. Summarize your results in a table that shows key financial ratios, retained earnings, and external financing requirements (if required) for each year, along with five-year totals for earnings and financing.
Please help!
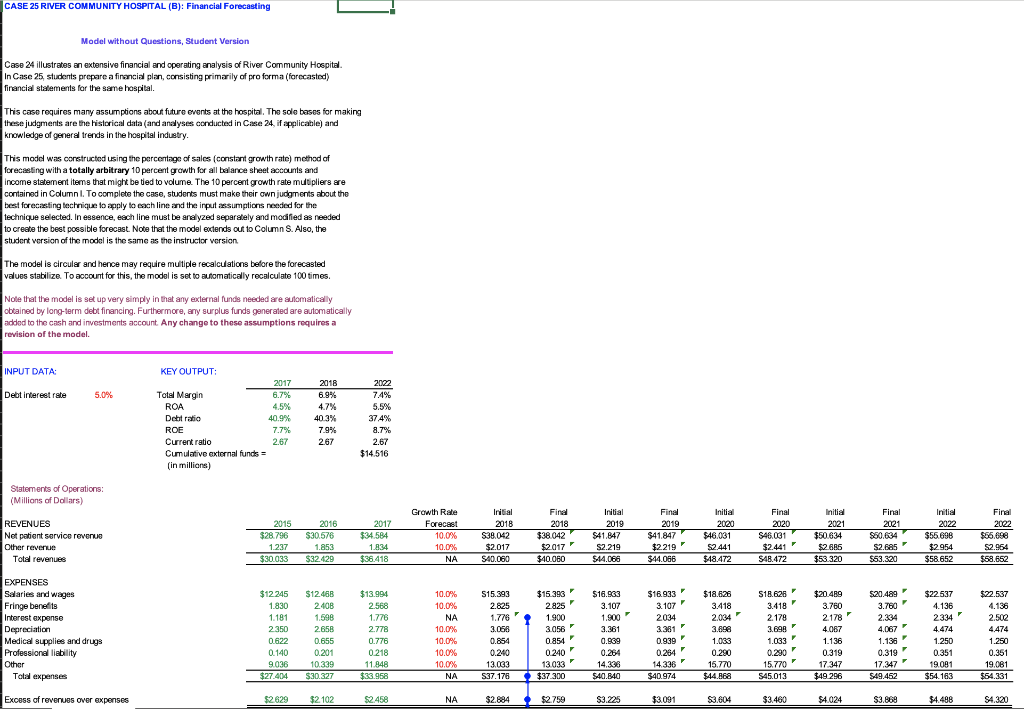
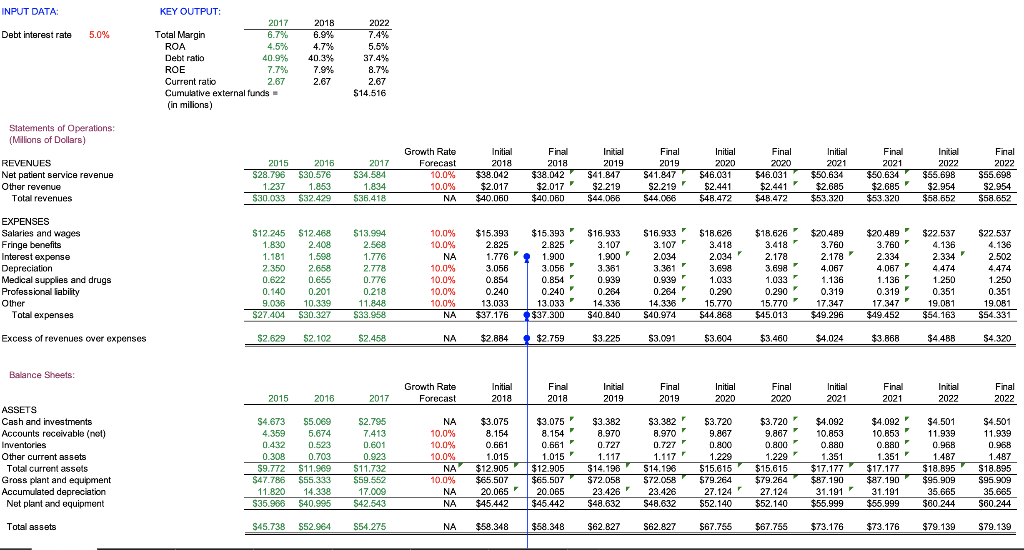
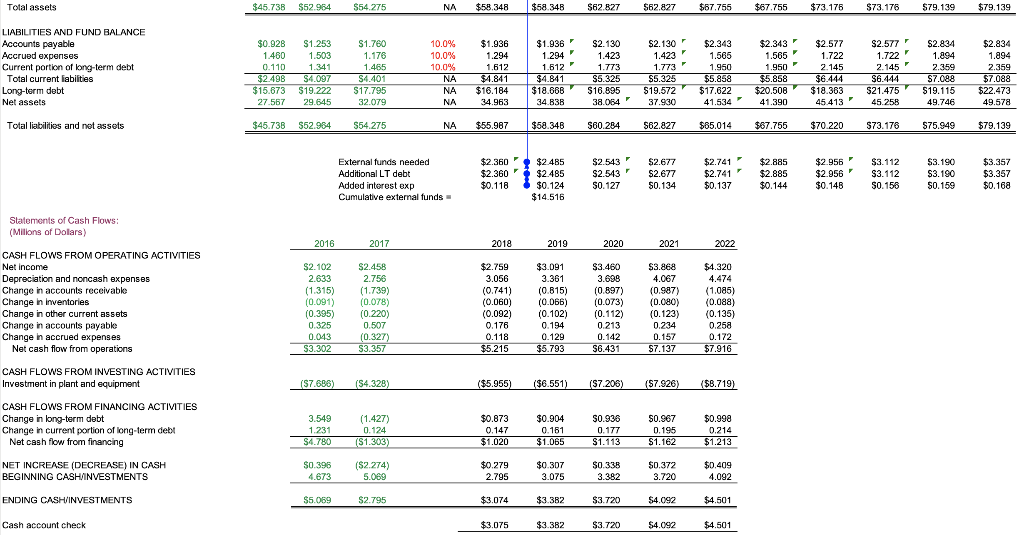
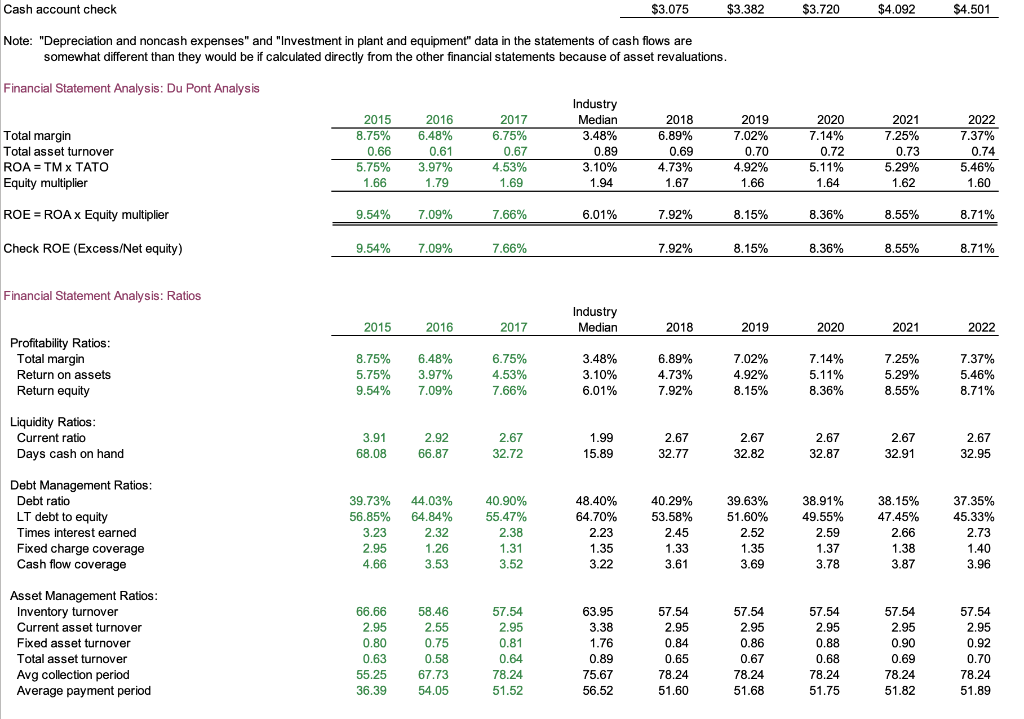
CASE 25 RIVER COMMUNITY HOSPITAL (B): Financial Forecasting Model without Questions, Student Version Case 24 illustrates an extensive financial and operating analysis of River Community Hospital In Case 25, students prepare a financial plan, consisting primarily of pro forma (forecasted) financial statements for the same hospital. This case requires many assumptions about future events at the hospital. The sole bases for making these judgments are the historical data (and analyses conducted in Case 24, if applicable) and knowledge of general trends in the hospital industry. This model was constructed using the percentage of sales (constant growth rate) method of forecasting with a totally arbitrary 10 percent growth for all balance sheet accounts and Income statement items that might be tied to volume. The 10 percent growth rate multipliers are contained in Column I. To complete the case, students must make their own judgments about the best forecasting technique to apply to each line and the input assumptions needed for the technique selected. In essence, each line must be analyzed separately and modified as needed to create the best possible forecast. Note that the model extends out to Column S. Also, the student version of the model is the same as the instructor version The model is circular and hence may require multiple recalculations before the forecasted values stabilize. To account for this, the model is set to automatically recalculate 100 times. Note that the model is set up very simply in that any external funds needed are automatically obtained by long-term debt financing. Furthermore, any surplus funds generated are automatically added to the cash and investments account Any change to these assumptions requires a revision of the model INPUT DATA: 2022 Debt interest rate 5.0% KEY OUTPUT: 2017 Total Margin 6.7% ROA 4.5% Deht ratio 40.9% ROE 7.7% Current ratio 2.67 Cumulative external funds = (in millions) 2018 6.9% 4.7% 40.3% 7.9% 2.67 5.5% 37.4% 8.7% % 2.67 $14.516 Statements of Operations: ( (Millions of Dollars) REVENUES Net patient service revenue Other revenue Tots revenues 2015 $28.796 1.237 $30.033 2016 $30.578 1.853 $32429 Growth Rate Forecast 10.0% 10.0% NA Final 2018 $41.847 2017 $34,584 1.834 $36.418 Initial 2018 S38,042 $2.017 S40.050 Final 2018 $38.042 $ $2017 $40.060 Initial 2018 S41.847 S2.219 $44.068 Initial 2020 $46.031 S2.441 $48.472 Final 2020 $46.631 $2.441 S48.472 Initial 2021 $50.634 $2685 $53.320 Final 2021 550.634 S2.685 $53.320 Initial 2022 $55.696 $2954 $58.652 Final 2022 $56.698 S2.964 $58.652 $ $2219 $44.066 $20.489 $16.933 $ 3.107 2034 3.780 F EXPENSES Salaries and wages Fringe benefits Interest expense Depreciation Medical supplies and drugs Professional liability Other Total expenses $12.245 1.830 1.181 2350 0.622 0.140 9.036 $27.404 $12.468 2408 1598 2.658 0.655 0.201 10.339 $30.327 $13.994 2.568 1.776 2.778 0.776 0.218 11.848 $33.958 10.0% 10.0% NA 10.0% 10.0% 10.0% 10.0% NA S15.393 2.825 1.776 3.066 0.854 0.240 13.063 $37.176 3.361 $15 393 2.825 1.900 3.056 0.854 0.240 13.033 $37.300 $16.933 3.107 1.800 3.381 0.999 0.264 14.336 $40.B40 $18.826 3.418 2.034 3.898 1.033 0.290 15.770 $44.868 S18.626 3.418 2.178 3.698 1.033 0.290 15.770 $45.013 $20 489 3.760 F 2.178 4.067 1.136 0.319 17.347 $49.296 0.939 0.234" 14336 $40.974 $22537 4.136 2334 4.474 1.250 0.351 19.091 $54.163 2.334 4.067 1.138 0.319 17.347 $49,452 $22.537 4.136 2.502 4.474 1.250 0.351 19.081 $54.331 Excess of revenues over expenses $2629 $2 102 $2.458 NA $2.894 $2.759 S3.225 $3.091 $3.604 $3.460 $4.024 S3.868 $4.498 $4.320 INPUT DATA: Debt interest rate 5.0% KEY OUTPUT: 2017 Total Margin 6.7% ROA 4.5% Debt ratio 40.9% ROE 7.7%. Current ratio 2.67 Cumulative external funds (in milions) 2018 6.9% 4.7% 40.3% 7.9% 2.67 2022 7.4% 5.5% 37.4% 8.7% % 2.67 $14.516 Statements of Operations: (Millions of Dollars) REVENUES Net patient service revenue Other revenue Total revenues Growth Rate Forecast 10.0% 10.0% NA 2015 2016 $28.796 $30.576 1.237 1.853 $30.033 $32.429 Initial 2018 $38.042 $2.017 $40.060 Final 2019 S41.847 2017 S34.584 1.834 $36.418 $ Final 2018 $38.042 $2.017 $40.060 Initial 2019 $41.847 $2.219 $44.056 Final 2020 $46.031 Initial 2020 $46.031 $2.441 $48.472 Initial 2021 $50.634 $2.685 $53,320 Final 2021 $50.634 $2.685 $53.320 Initial 2022 $55.698 $2.954 $58 652 Final 2022 S55.698 $2.954 $58.652 $2.219 $2.441 $44.066 $48.472 $16.933" $22.537 4.136 3.107 2.334 EXPENSES Salaries and wages Fringe benefits Interest expense Depreciation Medical supplies and drugs Professional labity Other Total expenses $12.245 1.830 1.181 2.350 0.622 0.140 9.036 $27.404 $12.468 2.408 1.598 2.658 0.655 0.201 10.339 S30.327 $13.994 2.568 1.776 2.778 0.776 0.218 11.848 $33.958 10.0% 10.0% NA 10.0% 10.0% 10.0% 10.0% NA $15.393 2.825 1.776 3.056 0.854 0.240 13.033 $37.176 $15.393 2.825 1.900 3.056 0.854 0.240 13.033 ) $37.300 $16.933 3.107 1.900 3.361 0.939 0.264 14.336 $40.840 2.034 3.361 0.939" 0.264 14.336 S40.974 $18.626 3.418 2.034" 3.698 1.033 0.290 15.770 $44.868 $18.626 $ 3.418 2.178 3.698 1.033 0.290 15.770 $45.013 $20.489 3.760 2.178 4,067 1.136 0.319 17.347 $49.296 $20.489 3.760 2.334 4.067 1.136 0.319 17.347 $49.452 4.474 1.250 0.351 19.081 $54.163 $22.537 4.136 2.502 4.474 1.250 0.351 19.081 $54.331 Excess of revenues over expenses $2.629 $2.102 $2.458 NA $2.884 $2.759 $3.225 53.091 $3.604 $3.460 $4.024 $3868 $4.488 $4.320 Balance Sheets Growth Rate Forecast Initial 2018 Final 2018 2017 Initial 2019 Final 2019 Initial 2020 Final 2020 Initial 2021 Fina 2021 2015 Initial 2022 2016 Final 2022 $3.382 8.970 0.727 ASSETS Cash and investments Accounts receivable (not) Inventories Other current assets Total current assets Gross plant and equipment Accumulated depreciation Net plant and equipment $4.673 $5.069 4.359 5.674 0.432 0.523 0.309 0.703 $9.772 $11.969 $47.786 $55.333 11.820 14.338 $35.988 S40.995 $ S2.795 7.413 0.601 0.923 $11.732 $59.552 17.009 $42.543 NA 10.0% 10.0% 10.0% NA 10.0% NA NA $3.075 8.154 0.661 1.015 $12.905 $65.507 20.065 $45.442 $3.075 8.154 0.661 1.015 $12.905 $65.507 20.065 $45.442 $3.382 8.970 0.727 1.117 $14.196 $72.05B 23.426 $48.632 1.117 $3.720 9.867 0.800 1.229 $15.615 $79.264 27.124 $52.140 $3.720 9.867 0.800 1.229 $15.615 $79.264 27.124 $52.140 $14.195 $72.058 23.426 S48.632 $4.092 10.853 0.880 1.351 $17.177 $87.190 31.1917 $55.999 $4.092 10.853 0.880 1.351 $17.177 $87.190 31.191 $55.999 $4.501 11.939 0.968 1.487 $18.895 $95.909 35.665 $60.244 $4.501 11.939 0.968 1.487 $18.895 $95.909 35.665 560.244 Total assets $45.738 S52.964 S54.275 NA $58.348 $58.348 $62.827 S62.827 $67.756 $67.756 $73.176 $73.176 $79.139 $79.139 Total assets $45.73 $52.984 $54 275 NA $58 348 $58 348 $62.827 $62.827 $67.755 $67.755 $73.176 $73.178 $79.139 $79.139 $2.130 $2.577 $1.938 1.294 1.512 - $2.343 1.565 LIABILITIES AND FUND BALANCE Accounts payable Accrued expenses Current portion of long-term debt Total current liabilities Long-term debt Net assets 1.722 $0.928 1.460 0.110 $2.498 $ $15.673 27.567 S1.760 1.176 1.465 $4.401 $17.795 32.079 $1.253 1.503 1.341 S4.097 $19.222 29.645 10.0% 10.0% 10.0% NA NA NA 1.950 - 2.145 $2.130 1.423 1.773 $5.325 $16.895 38.064 $1.936 1.294 1.612 $4.841 $16.184 34.963 $2.343 1.565 1.950 $5.858 $17.622 41.534 1.423 1.773 $5.325 $19.572 37.930 $2.577 1.722 2.145 $6.444 $18.363 F 45.413 S2.834 1.894 2.359 $7.088 S19.115 49.746 $2.834 1.894 2.359 $7.088 $ $22.473 49.578 $4.841 $18.6BB 34.838 $5.858 $20.500 41.390 $6.444 $21.475 45.258 Total liabilities and not assets $45.73 $52.984 $54,275 NA $55.987 $58.348 $60.284 $62.827 $ $65.014 $67.755 $70.220 $73.176 $75.949 $79.139 F F External funds needed Additional LT debt Added interest exp Cumulative external funds $2.360$2.485 $2.360$2.485 $0.118 $0.124 $14.516 $2.543 $2.543 $0.127 $2.677 $2.677 S0.134 $2.741 $2.741 $0.137 $2.885 $2.885 $0.144 $2.956 $2.956 $0.148 $3.112 $3.112 $0.156 $3.190 $3.190 $0.159 $3.357 $3.357 $0.168 Statements of Cash Flows: (Milions of Dolars) 2016 2017 2018 2019 2020 2021 2022 CASH FLOWS FROM OPERATING ACTIVITIES Net Income Depreciation and noncash expenses Change in accounts receivable Change in Inventories Change in other current assets Change in accounts payable Change in accrued expenses Net cash flow from operations $2.102 2.633 (1.315) (0.091) (0.395) 0.325 0.043 $3.302 $2.458 2.756 (1.739) (0.078) (0.220) 0.507 (0.327) ( S3.357 $2.759 3.056 (0.741) (0.060) (0.092) 0.176 0.118 $5.215 $3.091 3.361 (0.815) (0.066) (0.102) () 0.194 0.129 $5.793 $3.460 3.698 (0.897) (0.073) (0.112) 0.213 0.142 $6.431 $3.868 4.067 (0.987) (0.080 (0.123) 0.234 0.157 $7.137 $4.320 4.474 (1.085) ) (0.088) (0.135) ( 0.258 0.172 $7.916 CASH FLOWS FROM INVESTING ACTIVITIES Investment in plant and equipment (S7.686) (S4.3289 ($5.955) ($6.551) (S7.206) (S7.926) {$8.719) CASH FLOWS FROM FINANCING ACTIVITIES Change in long-term debt Change in current portion of long-term debt Net cash flow from financing 3.549 1.231 $4.780 (1.427) 0.124 (S1.303) $0.873 0.147 $1.020 $0.904 0.161 $1.065 $0.936 0.177 $1.113 $0.967 0.195 $1.162 $0.998 0.214 $1.213 NET INCREASE (DECREASE) IN CASH BEGINNING CASH/INVESTMENTS $0.395 4.673 ($2.274) 5.089 $0.279 2.795 $0.307 3.075 $0.338 3.382 $0.372 3.720 $0.409 4.092 ENDING CASHINVESTMENTS $5.069 $2.795 $3.074 $3.382 $3.720 $4.092 $ $4.501 Cash account check $3.075 $3.382 $3.720 $4.092 $4.501 Cash account check $3.075 $3.382 $3.720 $4.092 $4.501 Note: "Depreciation and noncash expenses" and "Investment in plant and equipment" data in the statements of cash flows are somewhat different than they would be if calculated directly from the other financial statements because of asset revaluations. Financial Statement Analysis: Du Pont Analysis Total margin Total asset turnover ROA = TM X TATO Equity multiplier 2015 8.75% 0.66 5.75% 1.66 2016 6.48% 0.61 3.97% 1.79 2017 6.75% 0.67 4.53% 1.69 Industry Median 3.48% 0.89 3.10% 1.94 2018 6.89% 0.69 4.73% 1.67 2019 7.02% 0.70 4.92% 1.66 2020 7.14% 0.72 5.11% 1.64 2021 7.25% 0.73 5.29% 1.62 2022 7.37% 0.74 5.46% 1.60 ROE = ROA X Equity multiplier 9.54% 7.09% 7.66% 6.01% 7.92% 8.15% 8.36% 8.55% 8.71% Check ROE (Excess/Net equity) 9.54% 7.09% 7.66% 7.92% 8.15% 8.36% 8.55% 8.71% Financial Statement Analysis: Ratios Industry Median 2015 2016 2017 2018 2019 2020 2021 2022 Profitability Ratios: Total margin Return on assets Return equity 8.75% 5.75% 9.54% 6.48% 3.97% 7.09% 6.75% 4.53% 7.66% 3.48% 3.10% 6.01% 6.89% 4.73% 7.92% 7.02% 4.92% 8.15% 7.14% 5.11% 8.36% 7.25% 5.29% 8.55% 7.37% 5.46% 8.71% Liquidity Ratios: Current ratio Days cash on hand 3.91 68.08 2.92 66.87 2.67 32.72 1.99 15.89 2.67 32.77 2.67 32.82 2.67 32.87 2.67 32.91 2.67 32.95 Debt Management Ratios: Debt ratio LT debt to equity Times interest earned Fixed charge coverage Cash flow coverage 39.73% 56.85% 3.23 2.95 4.66 44.03% 64.84% 2.32 1.26 3.53 40.90% 55.47% 2.38 1.31 3.52 48.40% 64.70% 2.23 1.35 3.22 40.29% 53.58% 2.45 1.33 3.61 39.63% 51.60% 2.52 1.35 3.69 38.91% 49.55% 2.59 1.37 3.78 38.15% 47.45% 2.66 1.38 3.87 37.35% 45.33% 2.73 1.40 3.96 Asset Management Ratios: Inventory turnover Current asset turnover Fixed asset turnover Total asset turnover Avg collection period Average payment period 66.66 2.95 0.80 0.63 55.25 36.39 58.46 2.55 0.75 0.58 67.73 54.05 57.54 2.95 0.81 0.64 78.24 51.52 63.95 3.38 1.76 0.89 75.67 56.52 57.54 2.95 0.84 0.65 78.24 51.60 57.54 2.95 0.86 0.67 78.24 51.68 57.54 2.95 0.88 0.68 78.24 51.75 57.54 2.95 0.90 0.69 78.24 51.82 57.54 2.95 0.92 0.70 78.24 51.89 CASE 25 RIVER COMMUNITY HOSPITAL (B): Financial Forecasting Model without Questions, Student Version Case 24 illustrates an extensive financial and operating analysis of River Community Hospital In Case 25, students prepare a financial plan, consisting primarily of pro forma (forecasted) financial statements for the same hospital. This case requires many assumptions about future events at the hospital. The sole bases for making these judgments are the historical data (and analyses conducted in Case 24, if applicable) and knowledge of general trends in the hospital industry. This model was constructed using the percentage of sales (constant growth rate) method of forecasting with a totally arbitrary 10 percent growth for all balance sheet accounts and Income statement items that might be tied to volume. The 10 percent growth rate multipliers are contained in Column I. To complete the case, students must make their own judgments about the best forecasting technique to apply to each line and the input assumptions needed for the technique selected. In essence, each line must be analyzed separately and modified as needed to create the best possible forecast. Note that the model extends out to Column S. Also, the student version of the model is the same as the instructor version The model is circular and hence may require multiple recalculations before the forecasted values stabilize. To account for this, the model is set to automatically recalculate 100 times. Note that the model is set up very simply in that any external funds needed are automatically obtained by long-term debt financing. Furthermore, any surplus funds generated are automatically added to the cash and investments account Any change to these assumptions requires a revision of the model INPUT DATA: 2022 Debt interest rate 5.0% KEY OUTPUT: 2017 Total Margin 6.7% ROA 4.5% Deht ratio 40.9% ROE 7.7% Current ratio 2.67 Cumulative external funds = (in millions) 2018 6.9% 4.7% 40.3% 7.9% 2.67 5.5% 37.4% 8.7% % 2.67 $14.516 Statements of Operations: ( (Millions of Dollars) REVENUES Net patient service revenue Other revenue Tots revenues 2015 $28.796 1.237 $30.033 2016 $30.578 1.853 $32429 Growth Rate Forecast 10.0% 10.0% NA Final 2018 $41.847 2017 $34,584 1.834 $36.418 Initial 2018 S38,042 $2.017 S40.050 Final 2018 $38.042 $ $2017 $40.060 Initial 2018 S41.847 S2.219 $44.068 Initial 2020 $46.031 S2.441 $48.472 Final 2020 $46.631 $2.441 S48.472 Initial 2021 $50.634 $2685 $53.320 Final 2021 550.634 S2.685 $53.320 Initial 2022 $55.696 $2954 $58.652 Final 2022 $56.698 S2.964 $58.652 $ $2219 $44.066 $20.489 $16.933 $ 3.107 2034 3.780 F EXPENSES Salaries and wages Fringe benefits Interest expense Depreciation Medical supplies and drugs Professional liability Other Total expenses $12.245 1.830 1.181 2350 0.622 0.140 9.036 $27.404 $12.468 2408 1598 2.658 0.655 0.201 10.339 $30.327 $13.994 2.568 1.776 2.778 0.776 0.218 11.848 $33.958 10.0% 10.0% NA 10.0% 10.0% 10.0% 10.0% NA S15.393 2.825 1.776 3.066 0.854 0.240 13.063 $37.176 3.361 $15 393 2.825 1.900 3.056 0.854 0.240 13.033 $37.300 $16.933 3.107 1.800 3.381 0.999 0.264 14.336 $40.B40 $18.826 3.418 2.034 3.898 1.033 0.290 15.770 $44.868 S18.626 3.418 2.178 3.698 1.033 0.290 15.770 $45.013 $20 489 3.760 F 2.178 4.067 1.136 0.319 17.347 $49.296 0.939 0.234" 14336 $40.974 $22537 4.136 2334 4.474 1.250 0.351 19.091 $54.163 2.334 4.067 1.138 0.319 17.347 $49,452 $22.537 4.136 2.502 4.474 1.250 0.351 19.081 $54.331 Excess of revenues over expenses $2629 $2 102 $2.458 NA $2.894 $2.759 S3.225 $3.091 $3.604 $3.460 $4.024 S3.868 $4.498 $4.320 INPUT DATA: Debt interest rate 5.0% KEY OUTPUT: 2017 Total Margin 6.7% ROA 4.5% Debt ratio 40.9% ROE 7.7%. Current ratio 2.67 Cumulative external funds (in milions) 2018 6.9% 4.7% 40.3% 7.9% 2.67 2022 7.4% 5.5% 37.4% 8.7% % 2.67 $14.516 Statements of Operations: (Millions of Dollars) REVENUES Net patient service revenue Other revenue Total revenues Growth Rate Forecast 10.0% 10.0% NA 2015 2016 $28.796 $30.576 1.237 1.853 $30.033 $32.429 Initial 2018 $38.042 $2.017 $40.060 Final 2019 S41.847 2017 S34.584 1.834 $36.418 $ Final 2018 $38.042 $2.017 $40.060 Initial 2019 $41.847 $2.219 $44.056 Final 2020 $46.031 Initial 2020 $46.031 $2.441 $48.472 Initial 2021 $50.634 $2.685 $53,320 Final 2021 $50.634 $2.685 $53.320 Initial 2022 $55.698 $2.954 $58 652 Final 2022 S55.698 $2.954 $58.652 $2.219 $2.441 $44.066 $48.472 $16.933" $22.537 4.136 3.107 2.334 EXPENSES Salaries and wages Fringe benefits Interest expense Depreciation Medical supplies and drugs Professional labity Other Total expenses $12.245 1.830 1.181 2.350 0.622 0.140 9.036 $27.404 $12.468 2.408 1.598 2.658 0.655 0.201 10.339 S30.327 $13.994 2.568 1.776 2.778 0.776 0.218 11.848 $33.958 10.0% 10.0% NA 10.0% 10.0% 10.0% 10.0% NA $15.393 2.825 1.776 3.056 0.854 0.240 13.033 $37.176 $15.393 2.825 1.900 3.056 0.854 0.240 13.033 ) $37.300 $16.933 3.107 1.900 3.361 0.939 0.264 14.336 $40.840 2.034 3.361 0.939" 0.264 14.336 S40.974 $18.626 3.418 2.034" 3.698 1.033 0.290 15.770 $44.868 $18.626 $ 3.418 2.178 3.698 1.033 0.290 15.770 $45.013 $20.489 3.760 2.178 4,067 1.136 0.319 17.347 $49.296 $20.489 3.760 2.334 4.067 1.136 0.319 17.347 $49.452 4.474 1.250 0.351 19.081 $54.163 $22.537 4.136 2.502 4.474 1.250 0.351 19.081 $54.331 Excess of revenues over expenses $2.629 $2.102 $2.458 NA $2.884 $2.759 $3.225 53.091 $3.604 $3.460 $4.024 $3868 $4.488 $4.320 Balance Sheets Growth Rate Forecast Initial 2018 Final 2018 2017 Initial 2019 Final 2019 Initial 2020 Final 2020 Initial 2021 Fina 2021 2015 Initial 2022 2016 Final 2022 $3.382 8.970 0.727 ASSETS Cash and investments Accounts receivable (not) Inventories Other current assets Total current assets Gross plant and equipment Accumulated depreciation Net plant and equipment $4.673 $5.069 4.359 5.674 0.432 0.523 0.309 0.703 $9.772 $11.969 $47.786 $55.333 11.820 14.338 $35.988 S40.995 $ S2.795 7.413 0.601 0.923 $11.732 $59.552 17.009 $42.543 NA 10.0% 10.0% 10.0% NA 10.0% NA NA $3.075 8.154 0.661 1.015 $12.905 $65.507 20.065 $45.442 $3.075 8.154 0.661 1.015 $12.905 $65.507 20.065 $45.442 $3.382 8.970 0.727 1.117 $14.196 $72.05B 23.426 $48.632 1.117 $3.720 9.867 0.800 1.229 $15.615 $79.264 27.124 $52.140 $3.720 9.867 0.800 1.229 $15.615 $79.264 27.124 $52.140 $14.195 $72.058 23.426 S48.632 $4.092 10.853 0.880 1.351 $17.177 $87.190 31.1917 $55.999 $4.092 10.853 0.880 1.351 $17.177 $87.190 31.191 $55.999 $4.501 11.939 0.968 1.487 $18.895 $95.909 35.665 $60.244 $4.501 11.939 0.968 1.487 $18.895 $95.909 35.665 560.244 Total assets $45.738 S52.964 S54.275 NA $58.348 $58.348 $62.827 S62.827 $67.756 $67.756 $73.176 $73.176 $79.139 $79.139 Total assets $45.73 $52.984 $54 275 NA $58 348 $58 348 $62.827 $62.827 $67.755 $67.755 $73.176 $73.178 $79.139 $79.139 $2.130 $2.577 $1.938 1.294 1.512 - $2.343 1.565 LIABILITIES AND FUND BALANCE Accounts payable Accrued expenses Current portion of long-term debt Total current liabilities Long-term debt Net assets 1.722 $0.928 1.460 0.110 $2.498 $ $15.673 27.567 S1.760 1.176 1.465 $4.401 $17.795 32.079 $1.253 1.503 1.341 S4.097 $19.222 29.645 10.0% 10.0% 10.0% NA NA NA 1.950 - 2.145 $2.130 1.423 1.773 $5.325 $16.895 38.064 $1.936 1.294 1.612 $4.841 $16.184 34.963 $2.343 1.565 1.950 $5.858 $17.622 41.534 1.423 1.773 $5.325 $19.572 37.930 $2.577 1.722 2.145 $6.444 $18.363 F 45.413 S2.834 1.894 2.359 $7.088 S19.115 49.746 $2.834 1.894 2.359 $7.088 $ $22.473 49.578 $4.841 $18.6BB 34.838 $5.858 $20.500 41.390 $6.444 $21.475 45.258 Total liabilities and not assets $45.73 $52.984 $54,275 NA $55.987 $58.348 $60.284 $62.827 $ $65.014 $67.755 $70.220 $73.176 $75.949 $79.139 F F External funds needed Additional LT debt Added interest exp Cumulative external funds $2.360$2.485 $2.360$2.485 $0.118 $0.124 $14.516 $2.543 $2.543 $0.127 $2.677 $2.677 S0.134 $2.741 $2.741 $0.137 $2.885 $2.885 $0.144 $2.956 $2.956 $0.148 $3.112 $3.112 $0.156 $3.190 $3.190 $0.159 $3.357 $3.357 $0.168 Statements of Cash Flows: (Milions of Dolars) 2016 2017 2018 2019 2020 2021 2022 CASH FLOWS FROM OPERATING ACTIVITIES Net Income Depreciation and noncash expenses Change in accounts receivable Change in Inventories Change in other current assets Change in accounts payable Change in accrued expenses Net cash flow from operations $2.102 2.633 (1.315) (0.091) (0.395) 0.325 0.043 $3.302 $2.458 2.756 (1.739) (0.078) (0.220) 0.507 (0.327) ( S3.357 $2.759 3.056 (0.741) (0.060) (0.092) 0.176 0.118 $5.215 $3.091 3.361 (0.815) (0.066) (0.102) () 0.194 0.129 $5.793 $3.460 3.698 (0.897) (0.073) (0.112) 0.213 0.142 $6.431 $3.868 4.067 (0.987) (0.080 (0.123) 0.234 0.157 $7.137 $4.320 4.474 (1.085) ) (0.088) (0.135) ( 0.258 0.172 $7.916 CASH FLOWS FROM INVESTING ACTIVITIES Investment in plant and equipment (S7.686) (S4.3289 ($5.955) ($6.551) (S7.206) (S7.926) {$8.719) CASH FLOWS FROM FINANCING ACTIVITIES Change in long-term debt Change in current portion of long-term debt Net cash flow from financing 3.549 1.231 $4.780 (1.427) 0.124 (S1.303) $0.873 0.147 $1.020 $0.904 0.161 $1.065 $0.936 0.177 $1.113 $0.967 0.195 $1.162 $0.998 0.214 $1.213 NET INCREASE (DECREASE) IN CASH BEGINNING CASH/INVESTMENTS $0.395 4.673 ($2.274) 5.089 $0.279 2.795 $0.307 3.075 $0.338 3.382 $0.372 3.720 $0.409 4.092 ENDING CASHINVESTMENTS $5.069 $2.795 $3.074 $3.382 $3.720 $4.092 $ $4.501 Cash account check $3.075 $3.382 $3.720 $4.092 $4.501 Cash account check $3.075 $3.382 $3.720 $4.092 $4.501 Note: "Depreciation and noncash expenses" and "Investment in plant and equipment" data in the statements of cash flows are somewhat different than they would be if calculated directly from the other financial statements because of asset revaluations. Financial Statement Analysis: Du Pont Analysis Total margin Total asset turnover ROA = TM X TATO Equity multiplier 2015 8.75% 0.66 5.75% 1.66 2016 6.48% 0.61 3.97% 1.79 2017 6.75% 0.67 4.53% 1.69 Industry Median 3.48% 0.89 3.10% 1.94 2018 6.89% 0.69 4.73% 1.67 2019 7.02% 0.70 4.92% 1.66 2020 7.14% 0.72 5.11% 1.64 2021 7.25% 0.73 5.29% 1.62 2022 7.37% 0.74 5.46% 1.60 ROE = ROA X Equity multiplier 9.54% 7.09% 7.66% 6.01% 7.92% 8.15% 8.36% 8.55% 8.71% Check ROE (Excess/Net equity) 9.54% 7.09% 7.66% 7.92% 8.15% 8.36% 8.55% 8.71% Financial Statement Analysis: Ratios Industry Median 2015 2016 2017 2018 2019 2020 2021 2022 Profitability Ratios: Total margin Return on assets Return equity 8.75% 5.75% 9.54% 6.48% 3.97% 7.09% 6.75% 4.53% 7.66% 3.48% 3.10% 6.01% 6.89% 4.73% 7.92% 7.02% 4.92% 8.15% 7.14% 5.11% 8.36% 7.25% 5.29% 8.55% 7.37% 5.46% 8.71% Liquidity Ratios: Current ratio Days cash on hand 3.91 68.08 2.92 66.87 2.67 32.72 1.99 15.89 2.67 32.77 2.67 32.82 2.67 32.87 2.67 32.91 2.67 32.95 Debt Management Ratios: Debt ratio LT debt to equity Times interest earned Fixed charge coverage Cash flow coverage 39.73% 56.85% 3.23 2.95 4.66 44.03% 64.84% 2.32 1.26 3.53 40.90% 55.47% 2.38 1.31 3.52 48.40% 64.70% 2.23 1.35 3.22 40.29% 53.58% 2.45 1.33 3.61 39.63% 51.60% 2.52 1.35 3.69 38.91% 49.55% 2.59 1.37 3.78 38.15% 47.45% 2.66 1.38 3.87 37.35% 45.33% 2.73 1.40 3.96 Asset Management Ratios: Inventory turnover Current asset turnover Fixed asset turnover Total asset turnover Avg collection period Average payment period 66.66 2.95 0.80 0.63 55.25 36.39 58.46 2.55 0.75 0.58 67.73 54.05 57.54 2.95 0.81 0.64 78.24 51.52 63.95 3.38 1.76 0.89 75.67 56.52 57.54 2.95 0.84 0.65 78.24 51.60 57.54 2.95 0.86 0.67 78.24 51.68 57.54 2.95 0.88 0.68 78.24 51.75 57.54 2.95 0.90 0.69 78.24 51.82 57.54 2.95 0.92 0.70 78.24 51.89Step by Step Solution
There are 3 Steps involved in it
Step: 1

Get Instant Access to Expert-Tailored Solutions
See step-by-step solutions with expert insights and AI powered tools for academic success
Step: 2

Step: 3
Ace Your Homework with AI
Get the answers you need in no time with our AI-driven, step-by-step assistance
Get Started
The New Managed Account Solutions Handbook
Authors: Stephen D. Gresham, Arlen S. Oransky
1st Edition
0470222786, 978-0470222782