Answered step by step
Verified Expert Solution
Question
1 Approved Answer
Cases Valid Missing Total RACE N Percent N Percent N Percent MORTALITY AFAM 51 100.0% 0 0.0% 51 100.0% NHW 51 100.0% 0 0.0% 51
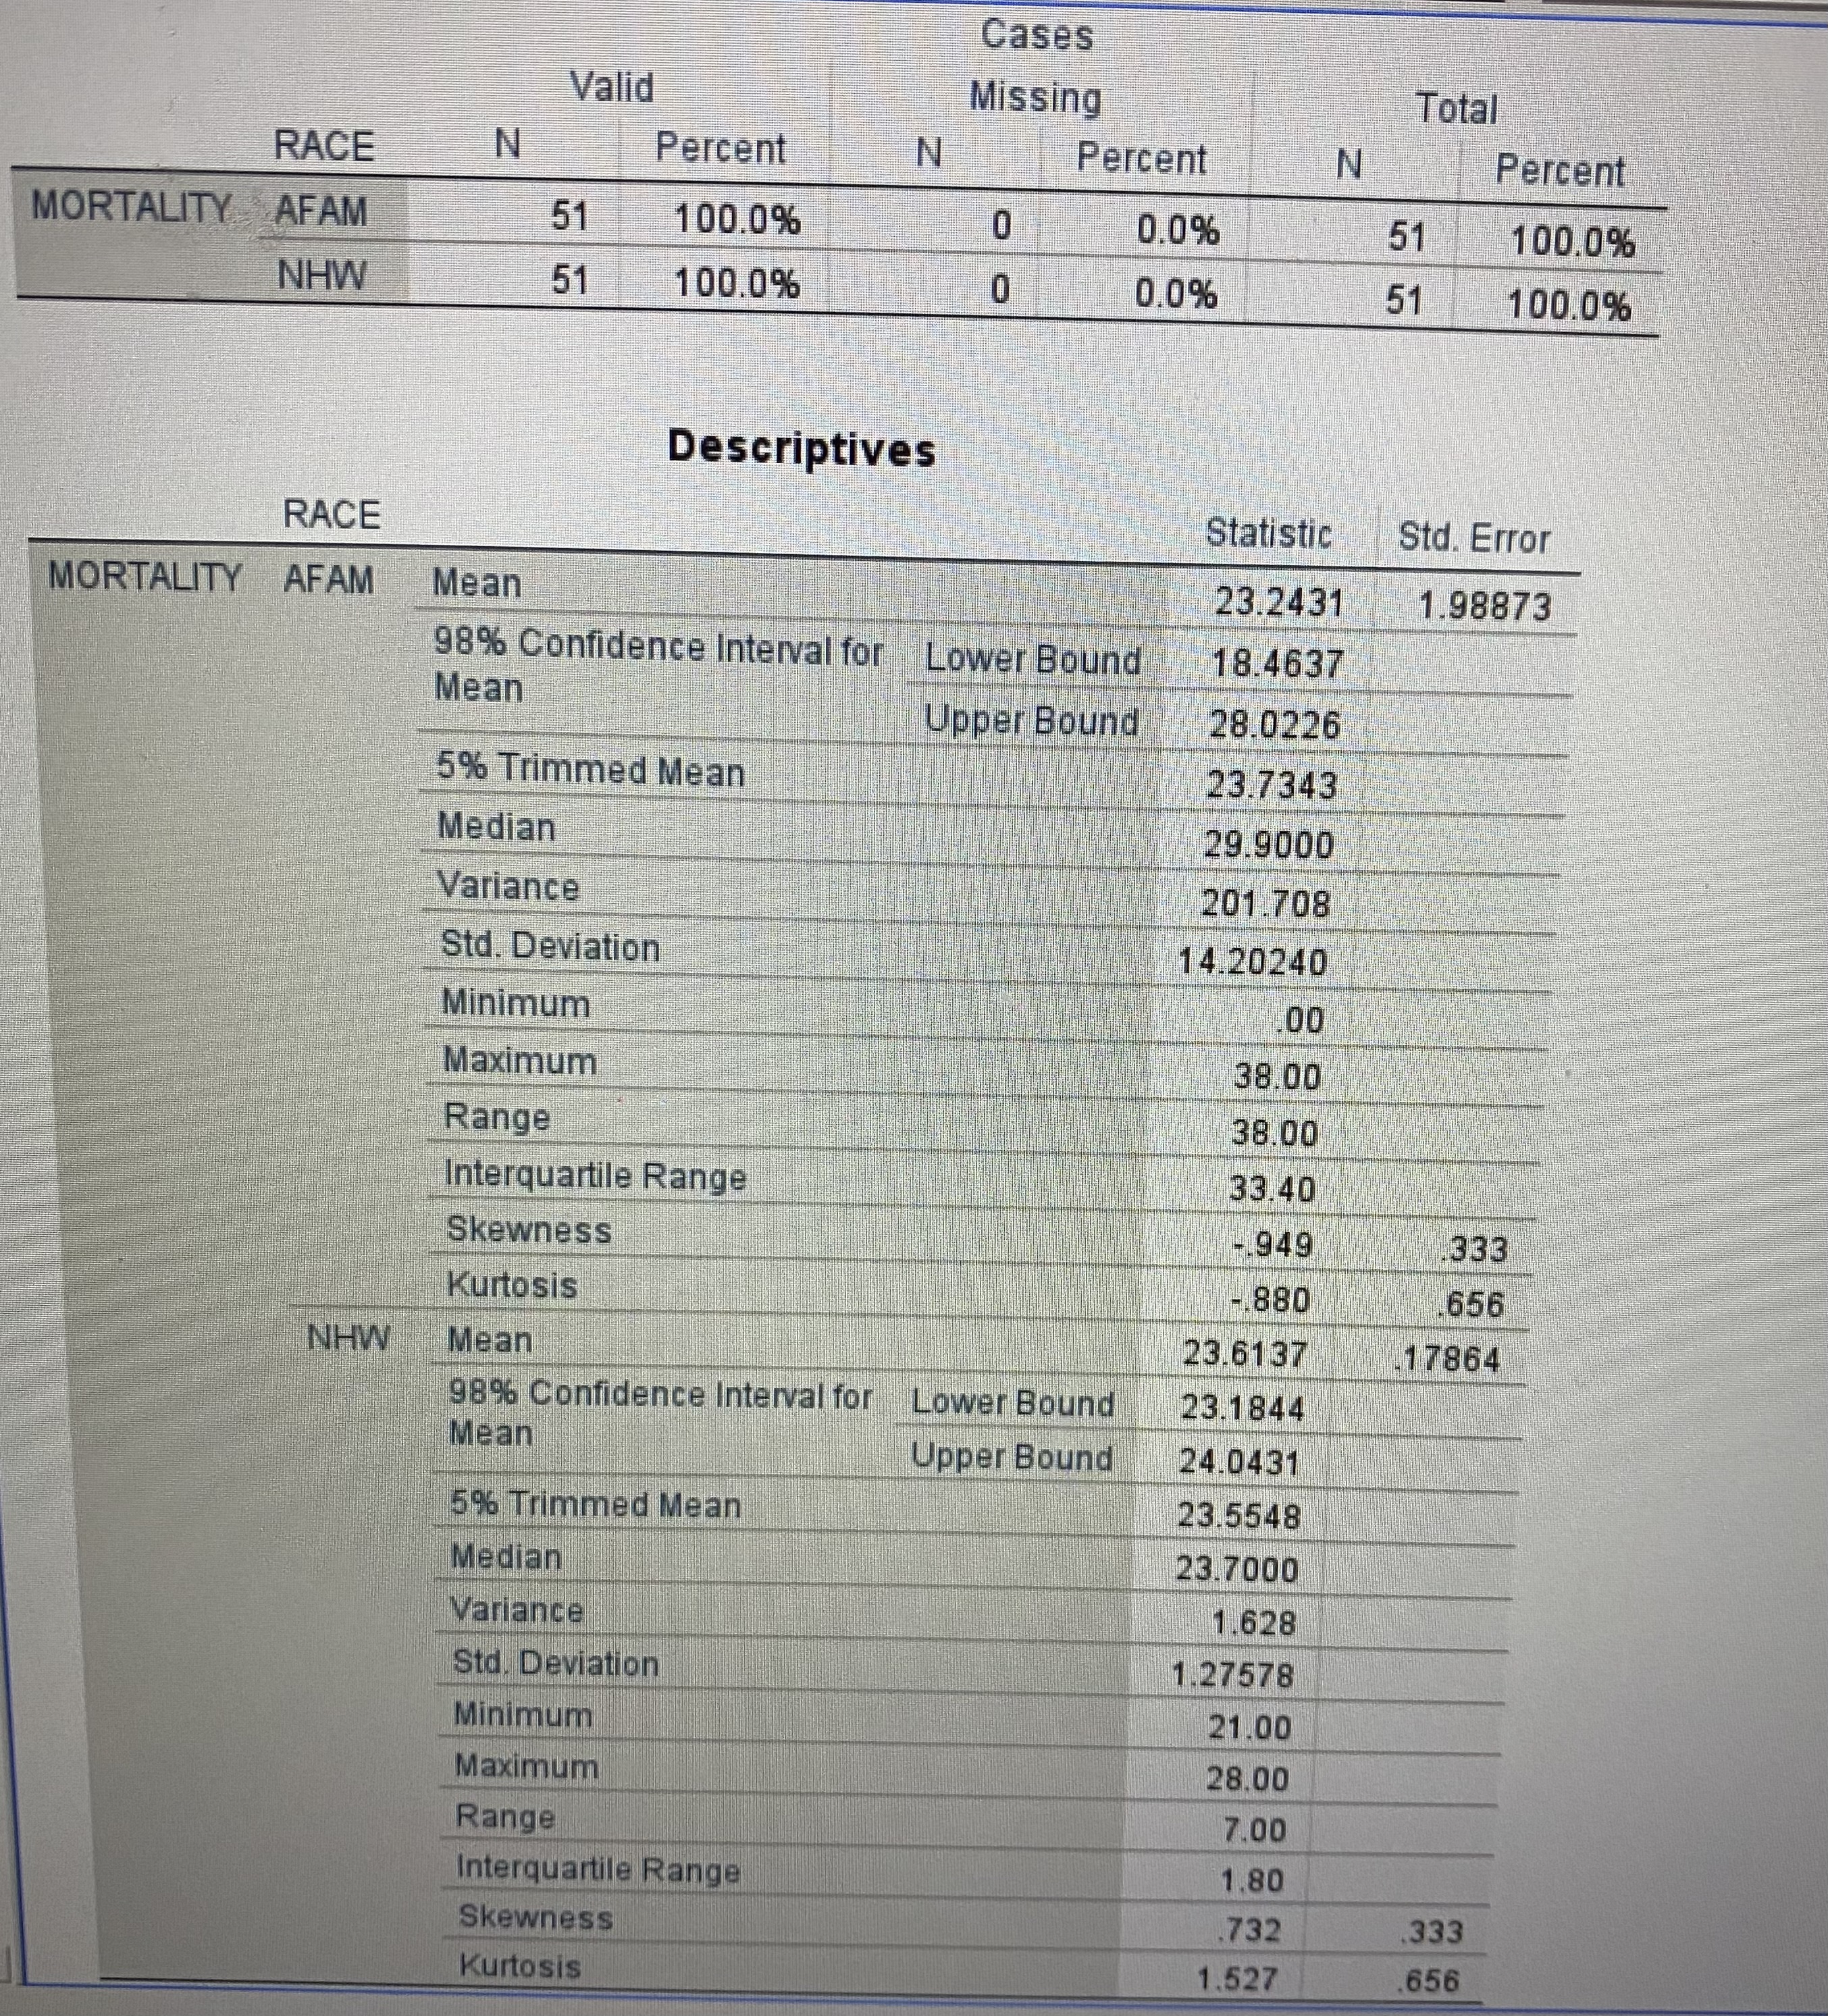
Cases Valid Missing Total RACE N Percent N Percent N Percent MORTALITY AFAM 51 100.0% 0 0.0% 51 100.0% NHW 51 100.0% 0 0.0% 51 100.0% Descriptives RACE Statistic Std. Error MORTALITY AFAM Mean 23.2431 1.98873 98% Confidence Interval for Lower Bound 18.4637 Mean Upper Bound 28.0226 5% Trimmed Mean 23.7343 Median 29.9000 Variance 201.708 Std. Deviation 14.20240 Minimum .00 Maximum 38.00 Range 38.00 Interquartile Range 33.40 Skewness .949 .333 Kurtosis - 880 656 NHW Mean 23.6137 1 7864 98% Confidence Interval for Lower Bound 23.1844 Mean Upper Bound 24.0431 5% Trimmed Mean 23.5548 Median 23.7000 Variance 1.628 Std. Deviation 1.27578 Minimum 21.00 Maximum 28.00 Range 7.00 Interquartile Range 1.80 Skewness 732 333 Kurtosis 1.527 656
Step by Step Solution
There are 3 Steps involved in it
Step: 1
Get Instant Access to Expert-Tailored Solutions
See step-by-step solutions with expert insights and AI powered tools for academic success
Step: 2
Step: 3
Ace Your Homework with AI
Get the answers you need in no time with our AI-driven, step-by-step assistance
Get Started