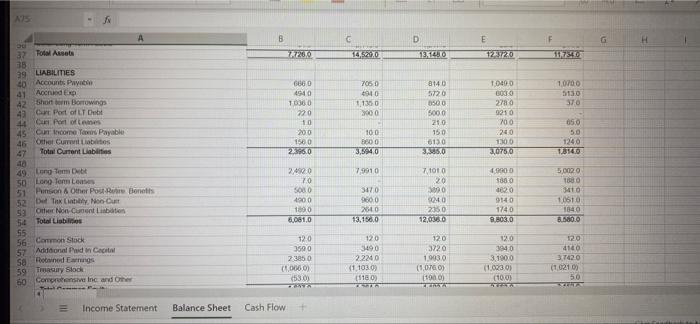
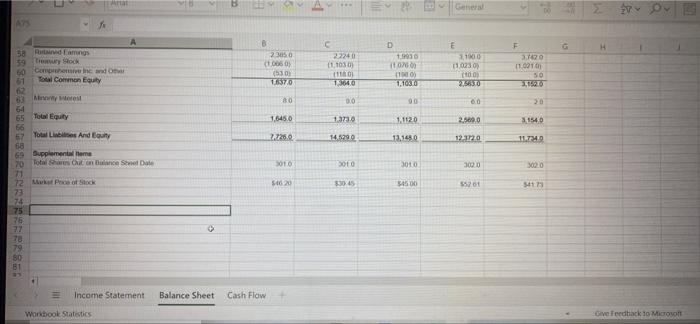
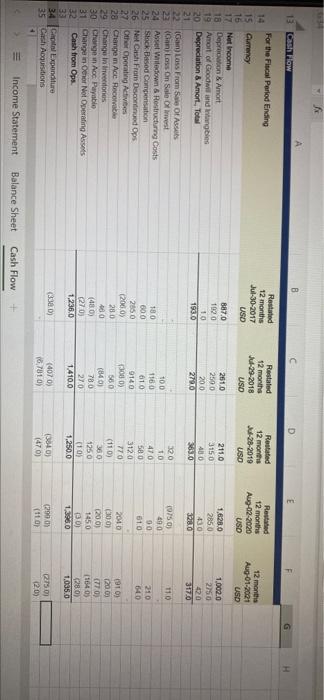
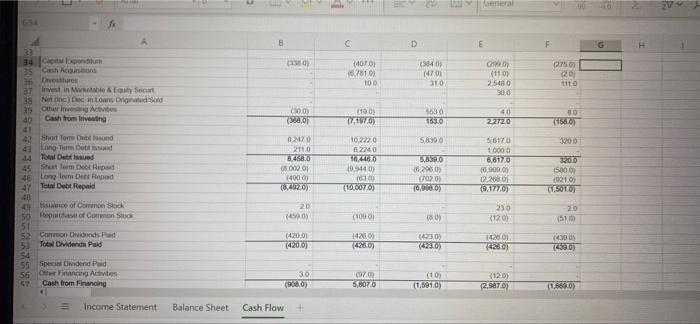
Cash Conversion Cycle d.) What is Campbell's Cash Conversion Cycle for the most recent five years (2017-2021)? I e.) What would you recommend if the company wanted to improve its Cash Conversion Cycle? Ik F170.03 8 D F For the Fal Period Ending 14 15 y Reclassified 12 months Jul-30-2017 USD Reclassified 12 months -20-2018 USD 12 months -28-2010 USD 12 months Aug-02-2020 12 months Aug-01-2021 USO 583/0 66150 1070 0.0010 8,4760 25428 18 de Ro Total Revenue 5,8370 6,615.0 8,1070 8,891.0 8.4760 21 Color Goods 22 Gross Prodit 3,3010 2460 4.1560 2.461.0 3000 2,7110 5.683.0 3.008.0 5602 20140 IRENAREN SARRAMA 10000 930 1.1770 010 13830 380 1,519,0 120 1.3000 840 24 Slingen AC 25 RADE 26 Decaton Art 27 Other Experincome 29 Other Operating Exp. Total Operating Income 12400) (2110) 1230 1060 (2860) 430 1,057.0 1,5940 1.717.0 1.200,0 1,503.0 14040 1.1170 1.291.0 1,610.0 (11503 33 34 Interest widtvest Income Net interest Exp (1830) 30 (1800) (3560) 20 (354.0) (345.09 40 (3410) (2100) 10 2000 (1150) Income Statement Balance Sheet Cash Flow + Workbook Statistics General O *F170.03 A C D E G H 11501 10 (0) (10) 1,3730 700.0 G40 1,400.0 (410) 2020) to os 1210 0000 1500 (903 (100) 10 (400) 111 540) 12201 (160) 37 Cecy Lens Loss) 38 Other NonOperating the 39 EBT Excl. Unusual 40 41 Reruing Chem 42 Rod Rest Charge Oost Canon Sen Olive Canton On Sale Of A 46 Asset 41 Legal Semana 48 Other Unters 49 ENT InclUnusume 50 51 Income Tax Expo 52 Emming from Cont. Op 53 31 Engs of Onconued Ops 55 Edmord om Account Change 56 Net Income to Company 57 58 Mint in Earn Net Income 60 13160 13076 250 7000 13500 100 9240 1080 7240 1510 4740 1740 582.0 3200 1 OOO (7) (2630) 10060 1001 6870 20150 2110 116280 170020 70 2670 21170 16280 10020 Income Statement Balance Sheet Cash Flow D E F H Balio Sheet as of C Reclassified Jul-29-2018 USO Jul-30-2017 USO Jul-28-2019 Aug-02-2020 USD Aug-01-2021 USO USO 3490 310.0 490 49.0 310 31.0 00 8590 090 69.0 15 Currency 16 ASSETS 17 Cash And Equivalent 18 Total Cash & ST Investments 19 20 Acous Recon 21 Owl Tot Receivables 23 5500 550 6050 5100 530 50370 5250 400 5760 5300 450 575.0 5440 510 5950 0000 740 1.000 070 7070 0336 MO 4000 1070 3710 000 25 Assets 26 Total Current Assets 22 28 Cens Property Port & Egmont 29 Acumstod Depreciation 30 Net Property, Plant & Equipment 31 32 Long torment 0,0430 500.00 2454.0 5,2300 2.773.00 2/460,0 52150 27000) 24560 5.500 (2.917 01 2,6220 57240 1100) 2.6050 33Good 600 221150 1.1180 300 340 770 40170 34150 20 38640 30640 20 2.145.0 1452970 3.900 313500 30010 12360 34 Orange 35 Deleted Tax ALT 36 Other Long Term Assets 27 Total Assets . Income Statement 12170 290 120 214.0 TRO Balance Sheet Cash Flow N D E 17200 1420 13/14 123720 7050 4940 1.1360 10700 5750 STO 6860 4940 10300 220 10 200 1560 23960 5000 8140 5720 0500 5000 210 150 6130 3O 10400 B030 278 0 9210 700 240 1300 3,075,0 100 3600 3,5940 05.0 50 1240 T. 37 Ral Assets BB 39 LIABILITIES 40 Accounts Paya 41 Achied Exp A2 Short Borowing 4 Car Port of LT Dutt 44 Port of 45 Cum coma Tas Payable 46 Other Current bites Total Current Liabetes 40 49. Long tembar 50 Long Term Les 51 Penson & Other Poster Bonets 52 De Toily. Non-Cut 53 Other NonnentLine 54 Total Liabi 55 56 Common Stock 57 Additional Pain Ceta Sa Rowned Earnings 59 Treasury Stock 60 Comprensive Inc and Omer 7.9910 7.100 20 5000 2:4500 70 SOBO 4900 100 6,061,0 1040 3470 2600 2640 13,160.0 49000 1880 1620 9140 1740 2.803.0 5.002 TO SMO 10610 1840 001 2350 12,090 120 120 3500 23850 (1.000) (530) 120 3490 2.2240 (1.1030 (1180 120 3220 10930 (1070) 1000 12.0 3940 3.1900 (1.623.09 (10.09 4140 37420 (102103 50 Income Statement Balance Sheet Cash Flow General H B 23050 (1005) (30) 1370 27240 11030) 11 1300 D 1930 11070 110) 11030 E 2100 110230 F 37620 11 BOTOL 30 2760 80 00 00 60 38 Rated Langs 60 Ceme On 51 Total Common Equy 2 More 64 65 Tol Equity 57 Total Libes And Buty 68 69 Supplementateme 70 Total Comune Se Date 1,645.0 1.33.0 1.1120 2.500.0 21540 27269 14.20 13.1430 12.9720 117340 SOTO 3010 3000 540 20 33045 34500 55701 SA 72 Mt Pecat Stock 73 74 75 76 77 70 79 Balance Sheet Cash Flow Income Statement Workbook Statistics Give Feedback to Micro 13 cashow Restated 12 months Jul-30-2017 USO Restated 12 months Jul-29-2018 USO Rotated 12 months Jul-28-2019 USO Restated 12 months Aug-02-2020 USD 12 months Aug-01-2021 USO 8870 1920 10 19370 2610 2500 20.0 211.0 3150 400 10 1,6280 2850 40 3200 1.002.0 2750 420 317.0 2/90 110 For the Fiscal Period Ending 14 15 Currency 16 17 Net Income 18 Depreciation & Amort 19 Amort of Goodwind intangibles 20 Depreciation & Amort. Total 21 22 am Loss From Sale Of Assets 22 (Can Loss On Sale Of Invest 24 Asset itdown & Restructuring Costs 25 Stock Based Compensation 26 Net Cash From Discontinued Ops 27 Other Operating Activities 28 Changem Ace Recoratie 29 Change in the ones 30 Change in Acc Payable 31 Change in Osor Not Operating Assets 32 Cash from Ops 33 34 Capital Expenditure 35 Cash Acquisitions 10.0 1160 610 9140 3000) 320 TO 470 580 3120 770 (110) 0750) 490 90 810 180 600 2050 (2000) 280 100 (480) (270 1.236.0 210 640 560 (840) 780 27.0 1.410.0 2010 200) (2003 1450 (30) 1250 (10) 1.250.0 (9103 (20.09 (TTO) (1640) (280) 1.035.0 (3380) (407) 16,78109 (340) (470) (290,00 (110) 2750 (20) Il Income Statement Balance Sheet Cash Flow General 2V 8 D H 0) (407) 16./8103 100 (340) (70 10 GO (110) 2.548 0 227500 20 1110 33 34 CE 35 Cash Action 36 37 Invest in Mobi & Securt 38 Notice in toam Ongnated Solid 39 Other investing is 40 Cash from Investing 41 G Short Tom Detsd LongTom Det 44 Total Debied 45 Short Term Dopad 46 Long Term Dafoed 47 Total Debt Repaid (30.01 7388.05 09.02 URO) 5530 16510 40 22720 00 (16) 58300 8.2020 2110 8.4580 800203 14000 620) 10,222.0 6220 0460 094401 5830 62060) (7020) 1080) 56170 10000 2017 0.0000 12.26602 (9.177.00 3.2010 15000 19210 (1.5010) [100070) 20 (50 (1000) (60) 230 (1200 20 ( 510) 142600 49 te of Contok 50 Pof Cans 51 52 Canon Dividends and 33 Total Dividends Paid 54 55 Orden Pad 56 Other Financing Activities Cash from Financing (4200) (4200) (30) (420) 14200 4260 14.00 10) 30 (9000) (7) 6,6070 (10) 11.501.0) (120 (2,987.0) 11,6680) Income Statement Balance Sheet Cash Flow + To Deted Sorumlar 46 Limited 47 Total De Rapat 84380 11.002.00 040000 67600) 16.O 0440 60 (100070) 3.590 0,2000 (7020) 16 658170 15.000 0.2680 7317709 12210 C5010 20 20 (10001 230 220 1600 142) 1200) (4200) (4230 (230) 4260 (4260) 14500 130 49 Common Stock 50 fpsicomoto 31 SOM Pod 55 Total Dividende Pad 54 55 Sand Paint 56 het ong Ad 57 Cash from Financing 58 59 Foreign Exchange 60 Met Change in Cash 6 120 10 (5080) 5070 (10 (15910) (1.600.0 110 (0) 120 10 (195.02 20 1900 6 65 66 07 Income Statement Balance Sheet Cash Flow Workbock Statistics Give Feedback to Micos