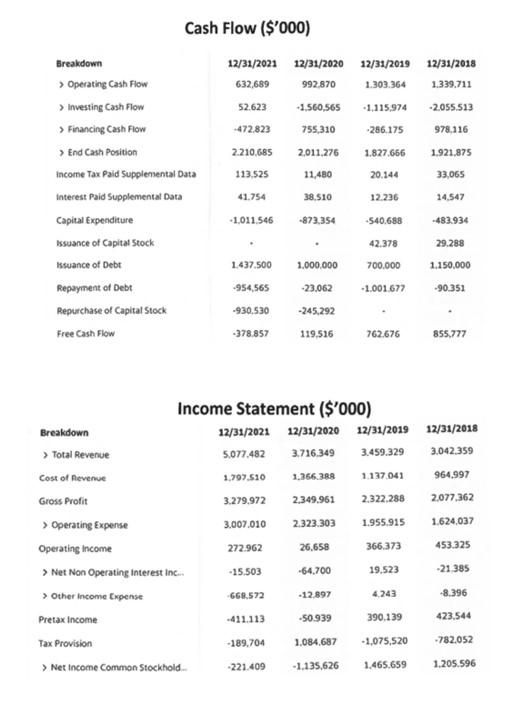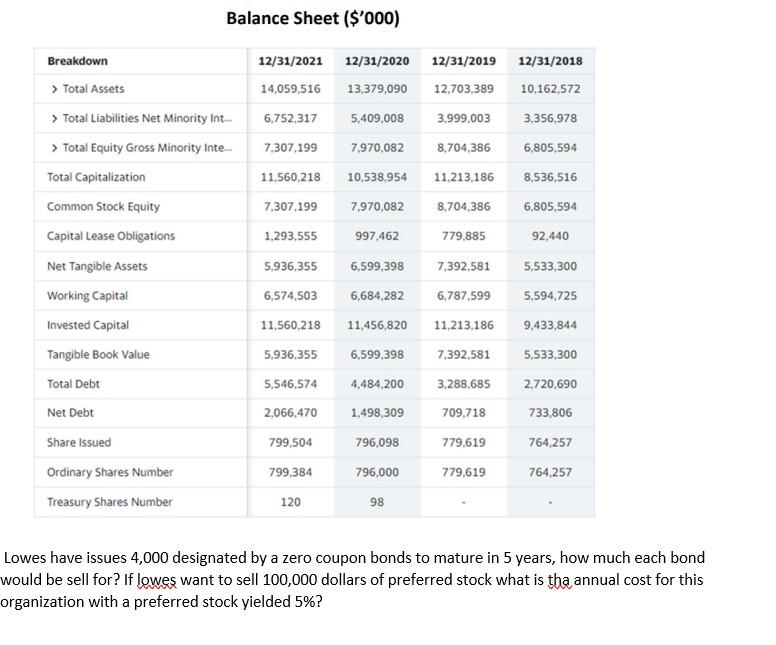

Cash Flow ($'000) 12/31/2019 12/31/2021 632,689 12/31/2018 1.339.711 1.303.364 52.623 -1.115.974 -2.055.513 12/31/2020 992,870 -1.560,565 755,310 2,011.276 11,480 -472.823 -286.175 978.116 2.210,685 1.827.666 1.921.875 113.525 20.144 33,065 Breakdown > Operating Cash Flow Investing Cash Flow > Financing Cash Flow > End Cash Position Income Tax Paid Supplemental Data Interest Paid Supplemental Data Capital Expenditure Issuance of Capital Stock Issuance of Debt Repayment of Debt Repurchase of Capital Stock Free Cash Flow 41.754 38.510 12.236 14.547 - 1.011.546 -873.354 -540.688 -483.934 42.378 29.288 1.437.500 1.000.000 700.000 1.150.000 954,565 -1.001.677 -90.351 -930.530 -23.062 -245.292 119,516 -378.857 762.676 855.777 12/31/2018 3.042,359 964.997 2077.362 1.624,037 Income Statement ($'000) Breakdown 12/31/2021 12/31/2020 12/31/2019 > Total Revenue 5.077482 3.716.349 3.459.329 Cost of Revenue 1.707.510 1.366.389 1.137041 Gross Profit 3.279,972 2.349.961 2.322.288 > Operating Expense 3.007.010 2.323.303 1.955.915 Operating Income 272.962 26.658 366.373 > Net Non Operating interest in -15.503 -64.700 19.523 > Other Income Expense 668.572 -12.897 4.243 Pretax income -411.113 -50.939 390.139 Tax Provision -189.704 1.084.687 - 1,075,520 > Net Income Common Stockhold -221.409 -1.135,626 1.465.659 453.325 -21 385 -8.396 423.544 -782,052 1.205.596 Balance Sheet($'000) 12/31/2021 12/31/2020 14,059,516 13,379,090 12/31/2019 12,703,389 12/31/2018 10,162,572 6,752,317 5,409.008 3,999,003 3,356,978 7,307,199 11.560.218 7.970,082 10,538,954 8,704,386 11,213,186 6,805,594 8,536,516 Breakdown > Total Assets > Total Liabilities Net Minority Int... > Total Equity Gross Minority Inte... Total Capitalization Common Stock Equity Capital Lease Obligations Net Tangible Assets Working Capital Invested Capital Tangible Book Value 7,307,199 7.970,082 8,704,386 6,805,594 1.293,555 997,462 779.885 92,440 5,936,355 6,599,398 7.392,581 5,533,300 6,684,282 6,787.599 5,594,725 6,574,503 11,560,218 11.456,820 11,213,186 9.433,844 5.936,355 6,599,398 7.392,581 5,533,300 5,546,574 4.484,200 3,288.685 2.720,690 Total Debt Net Debt 2,066,470 1,498,309 709.718 733,806 Share issued 799,504 796,098 779,619 764.257 799.384 796,000 779,619 764,257 Ordinary Shares Number Treasury Shares Number 120 98 Lowes have issues 4,000 designated by a zero coupon bonds to mature in 5 years, how much each bond would be sell for? If lowes want to sell 100,000 dollars of preferred stock what is the annual cost for this organization with a preferred stock yielded 5%? Cash Flow ($'000) 12/31/2019 12/31/2021 632,689 12/31/2018 1.339.711 1.303.364 52.623 -1.115.974 -2.055.513 12/31/2020 992,870 -1.560,565 755,310 2,011.276 11,480 -472.823 -286.175 978.116 2.210,685 1.827.666 1.921.875 113.525 20.144 33,065 Breakdown > Operating Cash Flow Investing Cash Flow > Financing Cash Flow > End Cash Position Income Tax Paid Supplemental Data Interest Paid Supplemental Data Capital Expenditure Issuance of Capital Stock Issuance of Debt Repayment of Debt Repurchase of Capital Stock Free Cash Flow 41.754 38.510 12.236 14.547 - 1.011.546 -873.354 -540.688 -483.934 42.378 29.288 1.437.500 1.000.000 700.000 1.150.000 954,565 -1.001.677 -90.351 -930.530 -23.062 -245.292 119,516 -378.857 762.676 855.777 12/31/2018 3.042,359 964.997 2077.362 1.624,037 Income Statement ($'000) Breakdown 12/31/2021 12/31/2020 12/31/2019 > Total Revenue 5.077482 3.716.349 3.459.329 Cost of Revenue 1.707.510 1.366.389 1.137041 Gross Profit 3.279,972 2.349.961 2.322.288 > Operating Expense 3.007.010 2.323.303 1.955.915 Operating Income 272.962 26.658 366.373 > Net Non Operating interest in -15.503 -64.700 19.523 > Other Income Expense 668.572 -12.897 4.243 Pretax income -411.113 -50.939 390.139 Tax Provision -189.704 1.084.687 - 1,075,520 > Net Income Common Stockhold -221.409 -1.135,626 1.465.659 453.325 -21 385 -8.396 423.544 -782,052 1.205.596 Balance Sheet($'000) 12/31/2021 12/31/2020 14,059,516 13,379,090 12/31/2019 12,703,389 12/31/2018 10,162,572 6,752,317 5,409.008 3,999,003 3,356,978 7,307,199 11.560.218 7.970,082 10,538,954 8,704,386 11,213,186 6,805,594 8,536,516 Breakdown > Total Assets > Total Liabilities Net Minority Int... > Total Equity Gross Minority Inte... Total Capitalization Common Stock Equity Capital Lease Obligations Net Tangible Assets Working Capital Invested Capital Tangible Book Value 7,307,199 7.970,082 8,704,386 6,805,594 1.293,555 997,462 779.885 92,440 5,936,355 6,599,398 7.392,581 5,533,300 6,684,282 6,787.599 5,594,725 6,574,503 11,560,218 11.456,820 11,213,186 9.433,844 5.936,355 6,599,398 7.392,581 5,533,300 5,546,574 4.484,200 3,288.685 2.720,690 Total Debt Net Debt 2,066,470 1,498,309 709.718 733,806 Share issued 799,504 796,098 779,619 764.257 799.384 796,000 779,619 764,257 Ordinary Shares Number Treasury Shares Number 120 98 Lowes have issues 4,000 designated by a zero coupon bonds to mature in 5 years, how much each bond would be sell for? If lowes want to sell 100,000 dollars of preferred stock what is the annual cost for this organization with a preferred stock yielded 5%


