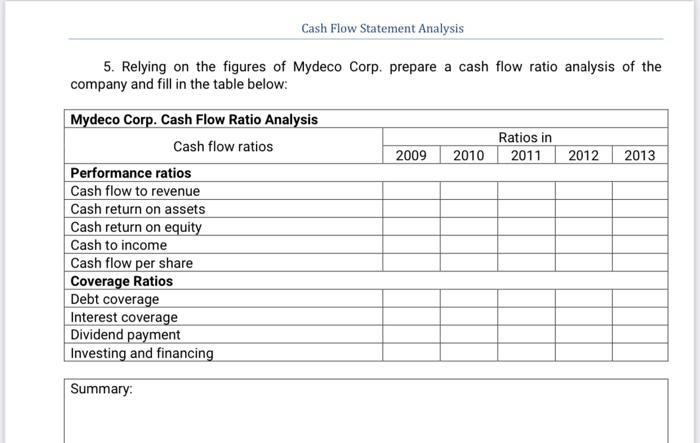
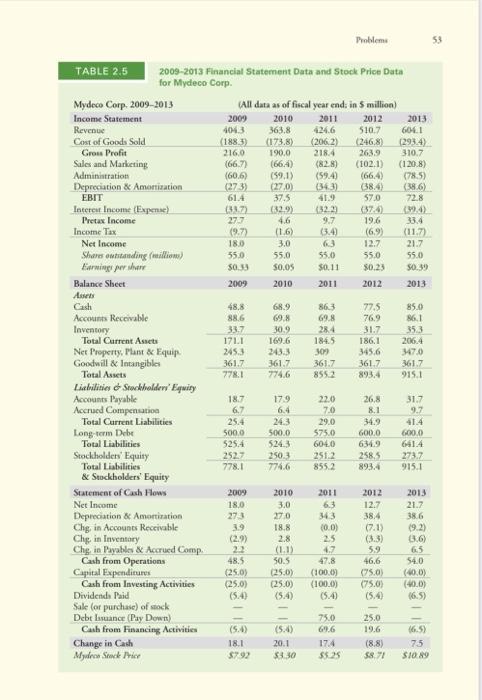
Cash Flow Statement Analysis 5. Relying on the figures of Mydeco Corp. prepare a cash flow ratio analysis of the company and fill in the table below: Mydeco Corp. Cash Flow Ratio Analysis Cash flow ratios Ratios in 2011 2009 2010 2012 2013 Performance ratios Cash flow to revenue Cash return on assets Cash return on equity Cash to income Cash flow per share Coverage Ratios Debt coverage Interest coverage Dividend payment Investing and financing Summary: Probleme 53 TABLE 2.5 2009-2013 Financial Statement Data and Stock Price Duta for Mydeco Corp. Mydeco Corp. 2009-2013 Income Statement Revenue Cost of Goods Sold Grous Profit Sales and Marketing Administration Depreciation & Amortization EBIT Interest Income (Expense) Pretax Income Income Tax (59.13 (All data as of fiscal year end; in 5 million) 2009 2010 2011 2012 2013 4043 363.8 4246 510.7 6011 (1883) (173.8) (2062) (246.8) (2934 216.0 190.0 2184 2639 310.7 (66.72 (66.4) (2.8) (102.1) (120.8) (60.6 (594) (66,4) (785) (273) (27.0 (343) (38.6 (386) 614 37.5 41.9 57.0 72.8 (38.7 (32.9 (1522 (376 (294) 27.7 4.6 9.7 19.6 33.4 (9.7 (16) (3.4) (6.9) (117) 180 3.0 12.7 21.7 55.0 55.0 550 55.0 55.0 $0.33 $0.05 30.11 $0.23 50.39 Net Income Shares attending (illions larning for her Balance Sheet 2009 2010 2011 2012 2013 863 77.5 76.9 69.8 48,8 88.6 33.7 1711 31.7 689 69.8 30.9 169.6 2433 361.7 7746 28.4 184.5 300 361.7 8552 2453 85.0 86.1 353 206.4 17.0 361.7 915.1 186,1 345.6 361.7 361.7 893.4 7781 179 22.0 70 18.7 6.7 25.4 5000 24.3 500.0 524.3 250.3 7746 29.0 575.0 6040 26.8 8.1 34.9 600.0 634.9 258,5 893.4 31.7 9.7 41.4 6000 641.4 273.7 915.1 5254 2527 778.1 251-2 855.2 Assets Cash Accounts Receivable Inventory Total Current Assets Net Property Plant & Equip Goodwill & Intangibles Total Assets Lichilities - Stockholders' Equity Accounts Payable Accrued Compensation Total Current Liabilities Long term Debe Total Liabilities Stockholders' Equity Total Liabilities & Suckholders' Equity Statement of Cash Flows Net Income Depreciation & Amortization Chg, in Accounts Receivable Che in Inventory Chg, in Payables & Accrued Comp. Cash from Operations Capital Expenditures Cash from Investing Activities Dividende Paid Sale (or purchase) of stock Debt Issuance Pay Down) Cash from Financing Activities Change in Cash Myyde Stock Phi 2009 2010 2011 2012 2015 18.0 63 12.7 21.7 273 38.4 38.6 1.9 (2.9) 22 48.5 (250) (25.0) 3.0 270 18.8 2.8 (1.1) 50.5 (25.0) (25.0) (5.4) 343 (0.0) 225 4.7 47.8 (1000) (100.0) (5.4 (7.1) (3.3) 59 46,6 (75.0) (750) 19.2) 0.6) 65 54.0 (400) (400) 75.0 25.0 19.6 (5.1) (5.4) 69.6 16.59 20.1 75 18 $792 17.4 $5.25 (8.8) 58 3830 $10.89