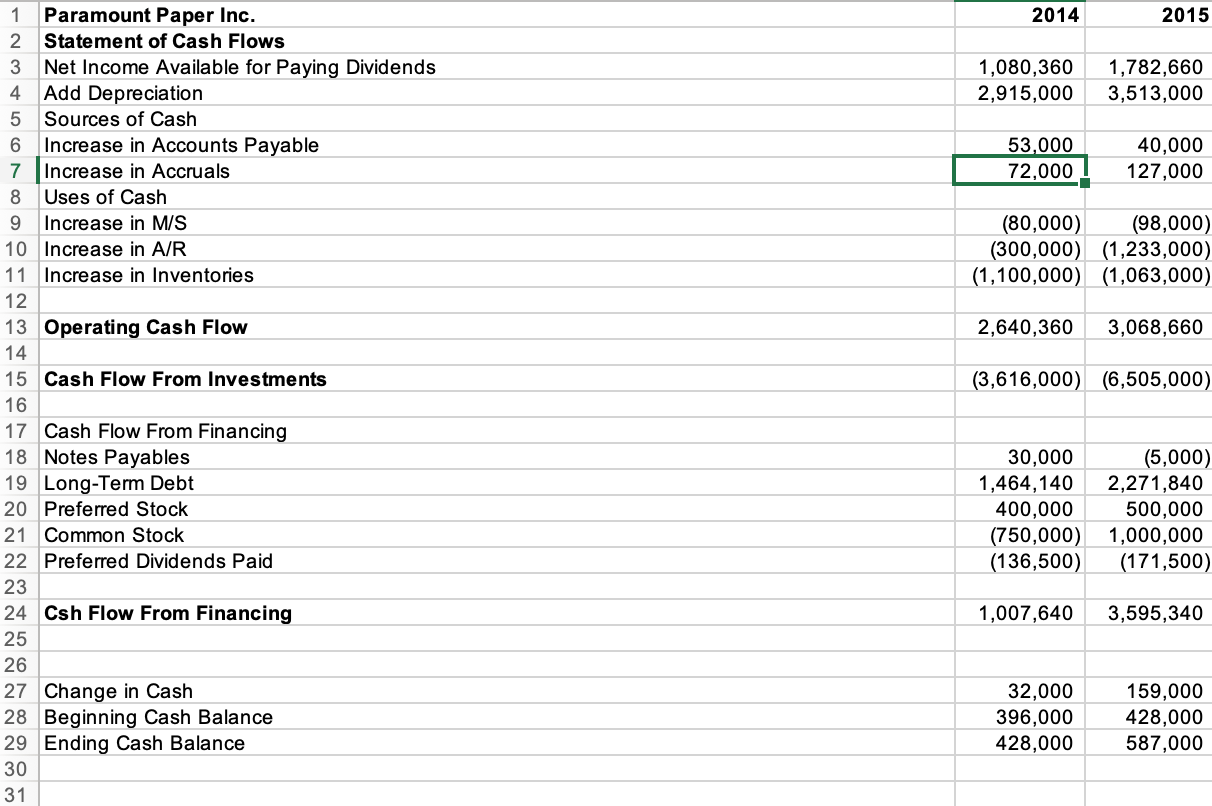
 Cash Flow statement
Question. PLEASE ANSWER QUESTION A to C
- Using common size statements present an appraisal of the companys performance and financial condition vis--vis its key competitors.
- Carry out a Du Pont analysis and interpret the results.
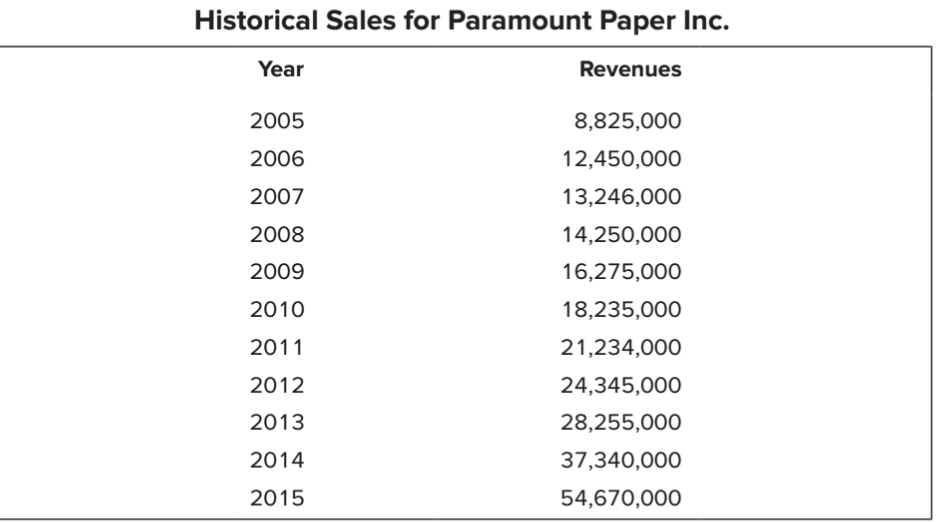
- How much additional sales can the company support without having to add fixed assets?
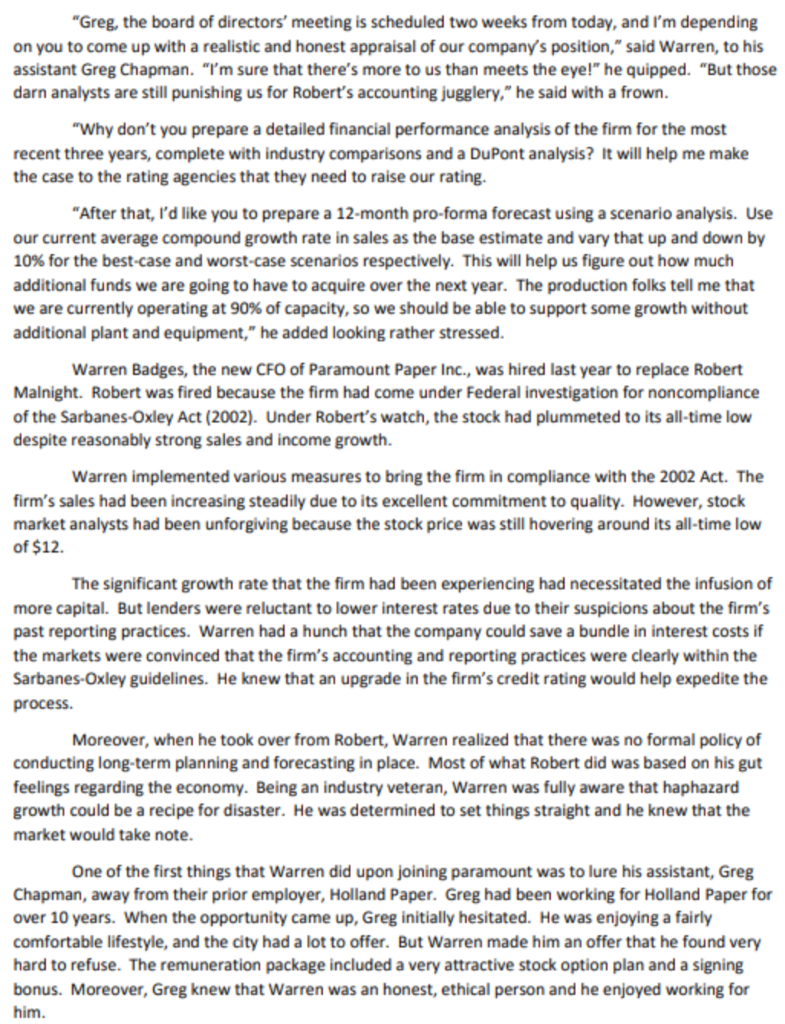
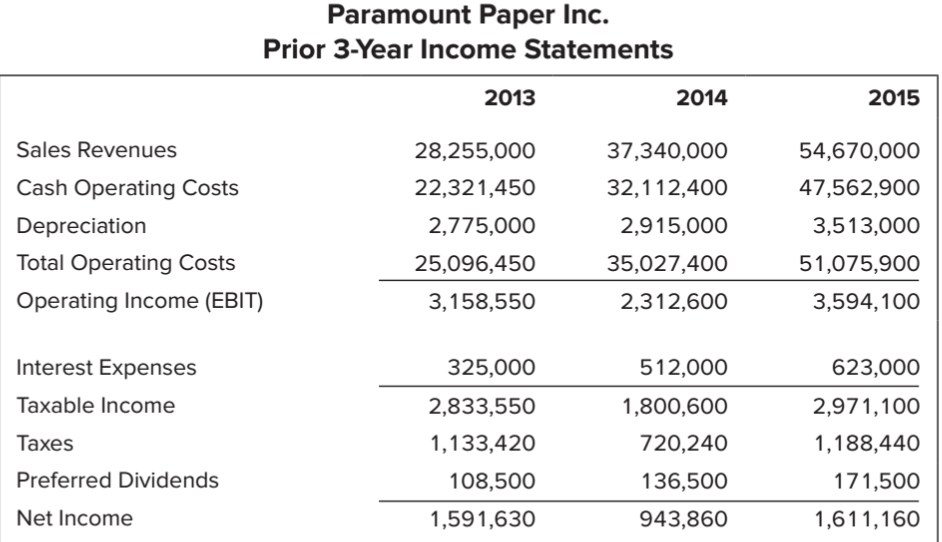
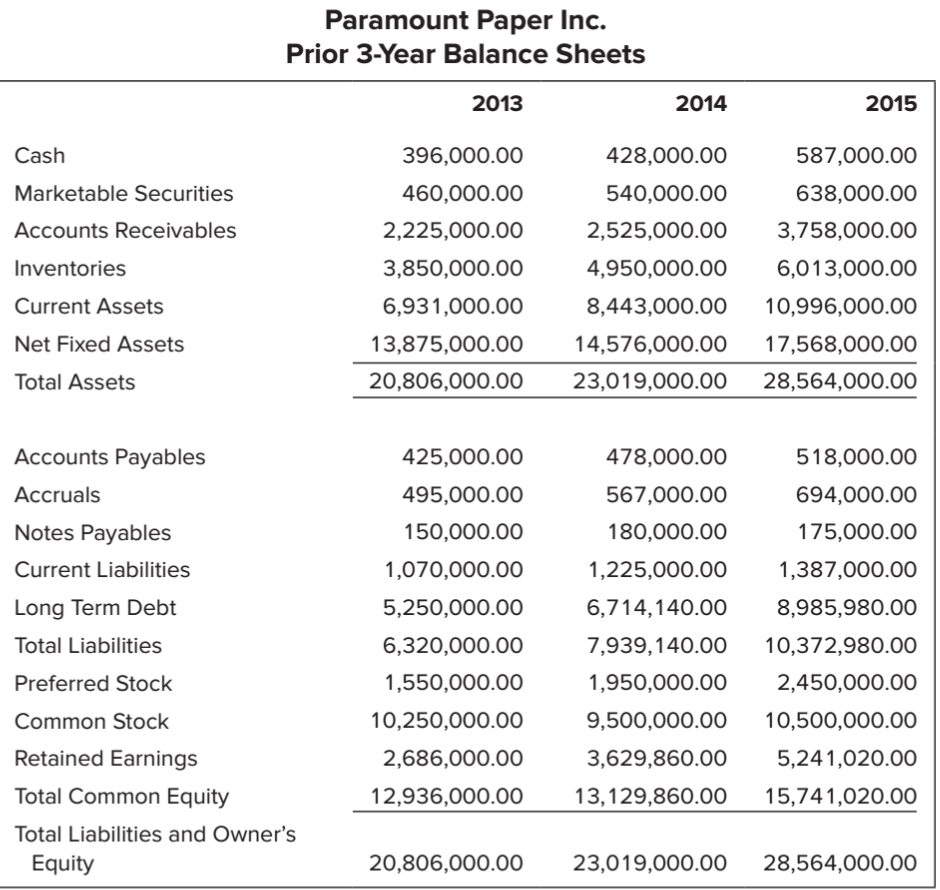
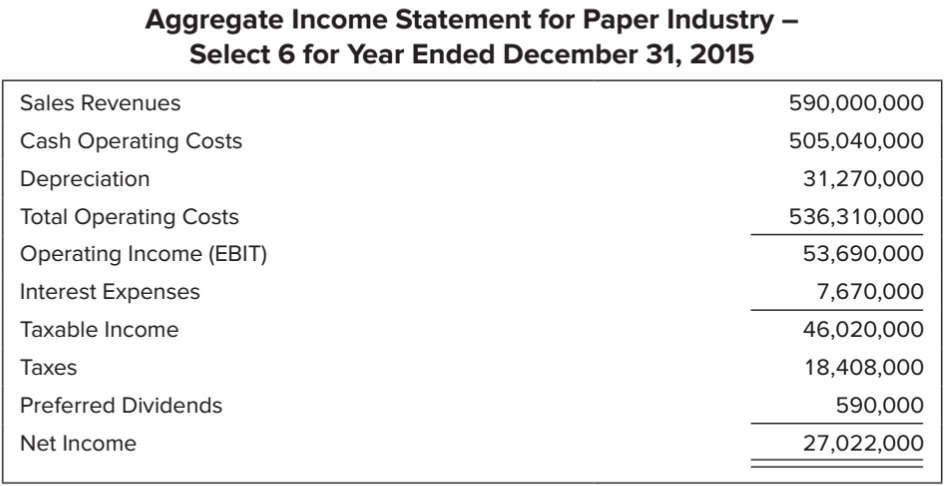
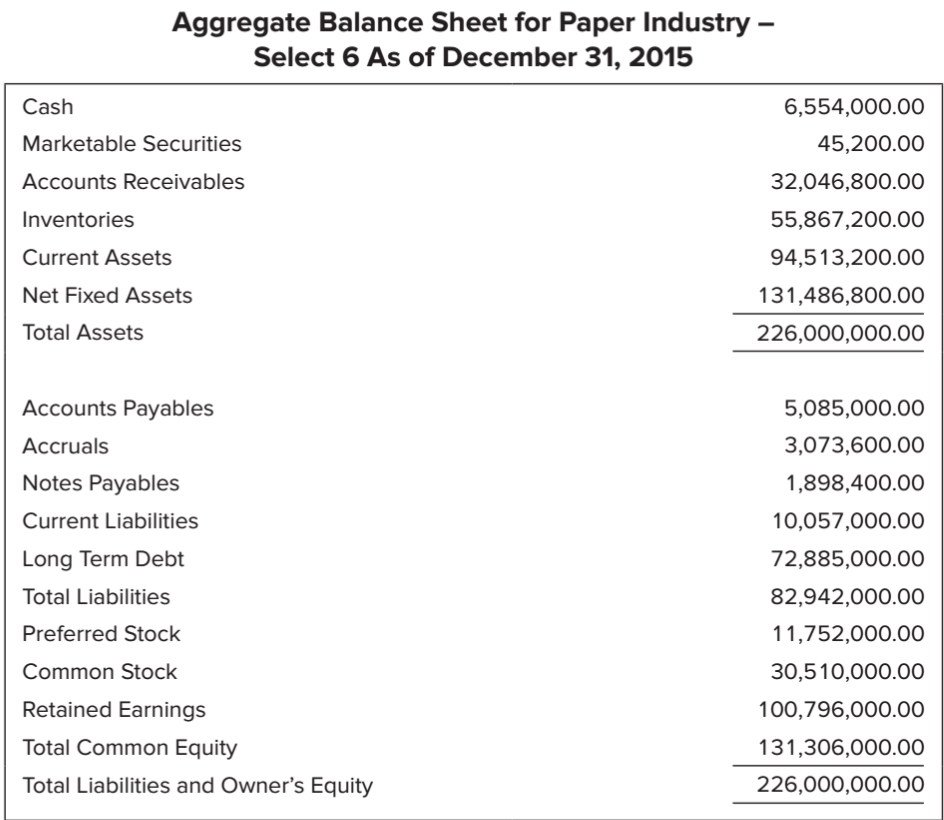
"Greg, the board of directors' meeting is scheduled two weeks from today, and I'm depending on you to come up with a realistic and honest appraisal of our company's position," said Warren, to his assistant Greg Chapman. "I'm sure that there's more to us than meets the eye!" he quipped. "But those darn analysts are still punishing us for Robert's accounting jugglery," he said with a frown. "Why don't you prepare a detailed financial performance analysis of the firm for the most recent three years, complete with industry comparisons and a DuPont analysis? It will help me make the case to the rating agencies that they need to raise our rating. "After that, I'd like you to prepare a 12-month pro-forma forecast using a scenario analysis. Use our current average compound growth rate in sales as the base estimate and vary that up and down by 10% for the best-case and worst-case scenarios respectively. This will help us figure out how much additional funds we are going to have to acquire over the next year. The production folks tell me that we are currently operating at 90% of capacity, so we should be able to support some growth without additional plant and equipment," he added looking rather stressed. Warren Badges, the new CFO of Paramount Paper Inc., was hired last year to replace Robert Malnight. Robert was fired because the firm had come under Federal investigation for noncompliance of the Sarbanes-Oxley Act (2002). Under Robert's watch, the stock had plummeted to its all-time low despite reasonably strong sales and income growth. Warren implemented various measures to bring the firm in compliance with the 2002 Act. The firm's sales had been increasing steadily due to its excellent commitment to quality. However, stock market analysts had been unforgiving because the stock price was still hovering around its all-time low of $12. The significant growth rate that the firm had been experiencing had necessitated the infusion of more capital. But lenders were reluctant to lower interest rates due to their suspicions about the firm's past reporting practices. Warren had a hunch that the company could save a bundle in interest costs if the markets were convinced that the firm's accounting and reporting practices were clearly within the Sarbanes-Oxley guidelines. He knew that an upgrade in the firm's credit rating would help expedite the process. Moreover, when he took over from Robert, Warren realized that there was no formal policy of conducting long-term planning and forecasting in place. Most of what Robert did was based on his gut feelings regarding the economy. Being an industry veteran, Warren was fully aware that haphazard growth could be a recipe for disaster. He was determined to set things straight and he knew that the market would take note. One of the first things that Warren did upon joining paramount was to lure his assistant, Greg Chapman, away from their prior employer, Holland Paper. Greg had been working for Holland Paper for over 10 years. When the opportunity came up, Greg initially hesitated. He was enjoying a fairly comfortable lifestyle, and the city had a lot to offer. But Warren made him an offer that he found very hard to refuse. The remuneration package included a very attractive stock option plan and a signing bonus. Moreover, Greg knew that Warren was an honest, ethical person and he enjoyed working for him. Paramount Paper Inc. Prior 3-Year Income Statements 2013 2014 2015 Sales Revenues Cash Operating Costs Depreciation Total Operating Costs Operating Income (EBIT) 28,255,000 22,321,450 2,775,000 25,096,450 3,158,550 37,340,000 32,112,400 2,915,000 35,027,400 2,312,600 54,670,000 47,562,900 3,513,000 51,075,900 3,594,100 512,000 Interest Expenses Taxable income Taxes Preferred Dividends Net Income 325,000 2,833,550 1,133,420 108,500 1,800,600 720,240 136,500 623,000 2,971,100 1,188,440 171,500 1,611,160 1,591,630 943,860 Paramount Paper Inc. Prior 3-Year Balance Sheets 2013 2014 2015 Cash Marketable Securities Accounts Receivables Inventories Current Assets Net Fixed Assets 396,000.00 460,000.00 2,225,000.00 3,850,000.00 6,931,000.00 13,875,000.00 20,806,000.00 428,000.00 540,000.00 2,525,000.00 4,950,000.00 8,443,000.00 14,576,000.00 23,019,000.00 587,000.00 638,000.00 3,758,000.00 6,013,000.00 10,996,000.00 17,568,000.00 28,564,000.00 Total Assets Accounts Payables Accruals Notes Payables Current Liabilities Long Term Debt Total Liabilities Preferred Stock Common Stock Retained Earnings Total Common Equity Total Liabilities and Owner's Equity 425,000.00 495,000.00 150,000.00 1,070,000.00 5,250,000.00 6,320,000.00 1,550,000.00 10,250,000.00 2,686,000.00 12,936,000.00 478,000.00 567,000.00 180,000.00 1,225,000.00 6,714,140.00 7,939,140.00 1,950,000.00 9,500,000.00 3,629,860.00 13,129,860.00 518,000.00 694,000.00 175,000.00 1,387,000.00 8,985,980.00 10,372,980.00 2,450,000.00 10,500,000.00 5,241,020.00 15,741,020.00 20,806,000.00 23,019,000.00 28,564,000.00 Aggregate Income Statement for Paper Industry - Select 6 for Year Ended December 31, 2015 Sales Revenues Cash Operating Costs Depreciation Total Operating Costs Operating Income (EBIT) Interest Expenses Taxable income Taxes Preferred Dividends Net Income 590,000,000 505,040,000 31,270,000 536,310,000 53,690,000 7,670,000 46,020,000 18,408,000 590,000 27,022,000 Aggregate Balance Sheet for Paper Industry - Select 6 As of December 31, 2015 Cash Marketable Securities Accounts Receivables Inventories Current Assets Net Fixed Assets Total Assets 6,554,000.00 45,200.00 32,046,800.00 55,867,200.00 94,513,200.00 131,486,800.00 226,000,000.00 Accounts Payables Accruals Notes Payables Current Liabilities Long Term Debt Total Liabilities Preferred Stock Common Stock Retained Earnings Total Common Equity Total Liabilities and Owner's Equity 5,085,000.00 3,073,600.00 1,898,400.00 10,057,000.00 72,885,000.00 82,942,000.00 11,752,000.00 30,510,000.00 100,796,000.00 131,306,000.00 226,000,000.00 Historical Sales for Paramount Paper Inc. Year Revenues 2005 2006 2007 2008 2009 2010 2011 2012 2013 2014 2015 8,825,000 12,450,000 13,246,000 14,250,000 16,275,000 18,235,000 21,234,000 24,345,000 28,255,000 37,340,000 54,670,000 2014 2015 1,080,360 2,915,000 1,782,660 3,513,000 1 Paramount Paper Inc. 2 Statement of Cash Flows 3 Net Income Available for Paying Dividends 4 Add Depreciation 5 Sources of Cash 6 Increase in Accounts Payable 7 Increase in Accruals 8 Uses of Cash Increase in M/S 10 Increase in A/R 11 Increase in Inventories 12 13 Operating Cash Flow 53,000 72,000! 40,000 127,000 9 Incre (80,000) (98,000) (300,000) (1,233,000) (1,100,000) (1,063,000) 2,640,360 3,068,660 14 (3,616,000) (6,505,000) 15 Cash Flow From Investments 16 17 Cash Flow From Financing 18 Notes Payables 19 Long-Term Debt 20 Preferred Stock 21 Common Stock 22 Preferred Dividends Paid 30.000 1,464,140 400,000 (750,000) (136,500) (5,000) 2,271,840 500,000 1,000,000 (171,500) 23 1,007,640 3,595,340 24 Csh Flow From Financing 25 26 27 Change in Cash 28 Beginning Cash Balance 29 Ending Cash Balance 30 31 32,000 396,000 428,000 159,000 428,000 587,000 "Greg, the board of directors' meeting is scheduled two weeks from today, and I'm depending on you to come up with a realistic and honest appraisal of our company's position," said Warren, to his assistant Greg Chapman. "I'm sure that there's more to us than meets the eye!" he quipped. "But those darn analysts are still punishing us for Robert's accounting jugglery," he said with a frown. "Why don't you prepare a detailed financial performance analysis of the firm for the most recent three years, complete with industry comparisons and a DuPont analysis? It will help me make the case to the rating agencies that they need to raise our rating. "After that, I'd like you to prepare a 12-month pro-forma forecast using a scenario analysis. Use our current average compound growth rate in sales as the base estimate and vary that up and down by 10% for the best-case and worst-case scenarios respectively. This will help us figure out how much additional funds we are going to have to acquire over the next year. The production folks tell me that we are currently operating at 90% of capacity, so we should be able to support some growth without additional plant and equipment," he added looking rather stressed. Warren Badges, the new CFO of Paramount Paper Inc., was hired last year to replace Robert Malnight. Robert was fired because the firm had come under Federal investigation for noncompliance of the Sarbanes-Oxley Act (2002). Under Robert's watch, the stock had plummeted to its all-time low despite reasonably strong sales and income growth. Warren implemented various measures to bring the firm in compliance with the 2002 Act. The firm's sales had been increasing steadily due to its excellent commitment to quality. However, stock market analysts had been unforgiving because the stock price was still hovering around its all-time low of $12. The significant growth rate that the firm had been experiencing had necessitated the infusion of more capital. But lenders were reluctant to lower interest rates due to their suspicions about the firm's past reporting practices. Warren had a hunch that the company could save a bundle in interest costs if the markets were convinced that the firm's accounting and reporting practices were clearly within the Sarbanes-Oxley guidelines. He knew that an upgrade in the firm's credit rating would help expedite the process. Moreover, when he took over from Robert, Warren realized that there was no formal policy of conducting long-term planning and forecasting in place. Most of what Robert did was based on his gut feelings regarding the economy. Being an industry veteran, Warren was fully aware that haphazard growth could be a recipe for disaster. He was determined to set things straight and he knew that the market would take note. One of the first things that Warren did upon joining paramount was to lure his assistant, Greg Chapman, away from their prior employer, Holland Paper. Greg had been working for Holland Paper for over 10 years. When the opportunity came up, Greg initially hesitated. He was enjoying a fairly comfortable lifestyle, and the city had a lot to offer. But Warren made him an offer that he found very hard to refuse. The remuneration package included a very attractive stock option plan and a signing bonus. Moreover, Greg knew that Warren was an honest, ethical person and he enjoyed working for him. Paramount Paper Inc. Prior 3-Year Income Statements 2013 2014 2015 Sales Revenues Cash Operating Costs Depreciation Total Operating Costs Operating Income (EBIT) 28,255,000 22,321,450 2,775,000 25,096,450 3,158,550 37,340,000 32,112,400 2,915,000 35,027,400 2,312,600 54,670,000 47,562,900 3,513,000 51,075,900 3,594,100 512,000 Interest Expenses Taxable income Taxes Preferred Dividends Net Income 325,000 2,833,550 1,133,420 108,500 1,800,600 720,240 136,500 623,000 2,971,100 1,188,440 171,500 1,611,160 1,591,630 943,860 Paramount Paper Inc. Prior 3-Year Balance Sheets 2013 2014 2015 Cash Marketable Securities Accounts Receivables Inventories Current Assets Net Fixed Assets 396,000.00 460,000.00 2,225,000.00 3,850,000.00 6,931,000.00 13,875,000.00 20,806,000.00 428,000.00 540,000.00 2,525,000.00 4,950,000.00 8,443,000.00 14,576,000.00 23,019,000.00 587,000.00 638,000.00 3,758,000.00 6,013,000.00 10,996,000.00 17,568,000.00 28,564,000.00 Total Assets Accounts Payables Accruals Notes Payables Current Liabilities Long Term Debt Total Liabilities Preferred Stock Common Stock Retained Earnings Total Common Equity Total Liabilities and Owner's Equity 425,000.00 495,000.00 150,000.00 1,070,000.00 5,250,000.00 6,320,000.00 1,550,000.00 10,250,000.00 2,686,000.00 12,936,000.00 478,000.00 567,000.00 180,000.00 1,225,000.00 6,714,140.00 7,939,140.00 1,950,000.00 9,500,000.00 3,629,860.00 13,129,860.00 518,000.00 694,000.00 175,000.00 1,387,000.00 8,985,980.00 10,372,980.00 2,450,000.00 10,500,000.00 5,241,020.00 15,741,020.00 20,806,000.00 23,019,000.00 28,564,000.00 Aggregate Income Statement for Paper Industry - Select 6 for Year Ended December 31, 2015 Sales Revenues Cash Operating Costs Depreciation Total Operating Costs Operating Income (EBIT) Interest Expenses Taxable income Taxes Preferred Dividends Net Income 590,000,000 505,040,000 31,270,000 536,310,000 53,690,000 7,670,000 46,020,000 18,408,000 590,000 27,022,000 Aggregate Balance Sheet for Paper Industry - Select 6 As of December 31, 2015 Cash Marketable Securities Accounts Receivables Inventories Current Assets Net Fixed Assets Total Assets 6,554,000.00 45,200.00 32,046,800.00 55,867,200.00 94,513,200.00 131,486,800.00 226,000,000.00 Accounts Payables Accruals Notes Payables Current Liabilities Long Term Debt Total Liabilities Preferred Stock Common Stock Retained Earnings Total Common Equity Total Liabilities and Owner's Equity 5,085,000.00 3,073,600.00 1,898,400.00 10,057,000.00 72,885,000.00 82,942,000.00 11,752,000.00 30,510,000.00 100,796,000.00 131,306,000.00 226,000,000.00 Historical Sales for Paramount Paper Inc. Year Revenues 2005 2006 2007 2008 2009 2010 2011 2012 2013 2014 2015 8,825,000 12,450,000 13,246,000 14,250,000 16,275,000 18,235,000 21,234,000 24,345,000 28,255,000 37,340,000 54,670,000 2014 2015 1,080,360 2,915,000 1,782,660 3,513,000 1 Paramount Paper Inc. 2 Statement of Cash Flows 3 Net Income Available for Paying Dividends 4 Add Depreciation 5 Sources of Cash 6 Increase in Accounts Payable 7 Increase in Accruals 8 Uses of Cash Increase in M/S 10 Increase in A/R 11 Increase in Inventories 12 13 Operating Cash Flow 53,000 72,000! 40,000 127,000 9 Incre (80,000) (98,000) (300,000) (1,233,000) (1,100,000) (1,063,000) 2,640,360 3,068,660 14 (3,616,000) (6,505,000) 15 Cash Flow From Investments 16 17 Cash Flow From Financing 18 Notes Payables 19 Long-Term Debt 20 Preferred Stock 21 Common Stock 22 Preferred Dividends Paid 30.000 1,464,140 400,000 (750,000) (136,500) (5,000) 2,271,840 500,000 1,000,000 (171,500) 23 1,007,640 3,595,340 24 Csh Flow From Financing 25 26 27 Change in Cash 28 Beginning Cash Balance 29 Ending Cash Balance 30 31 32,000 396,000 428,000 159,000 428,000 587,000