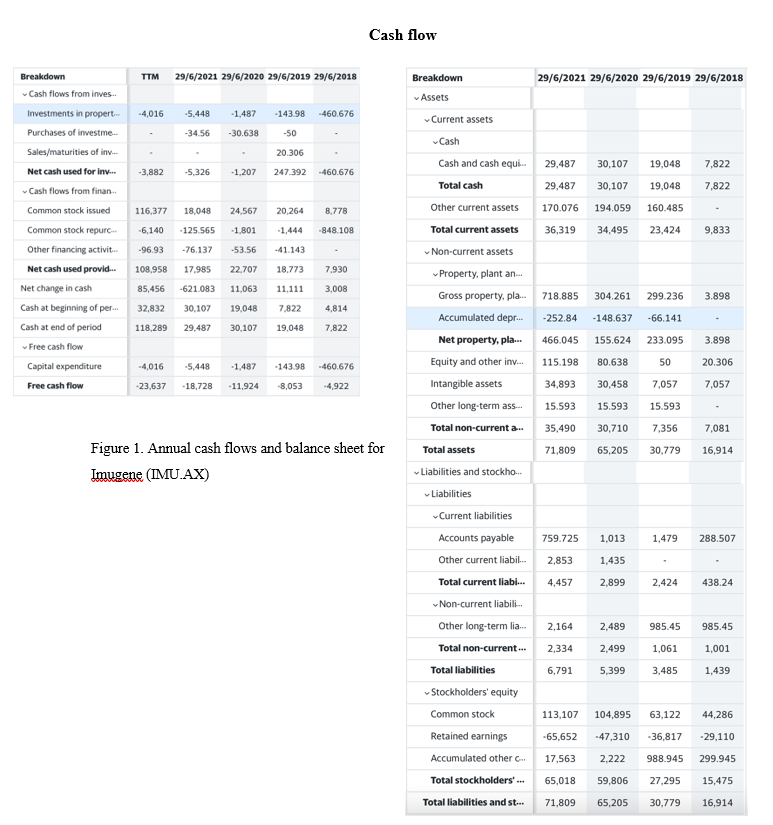
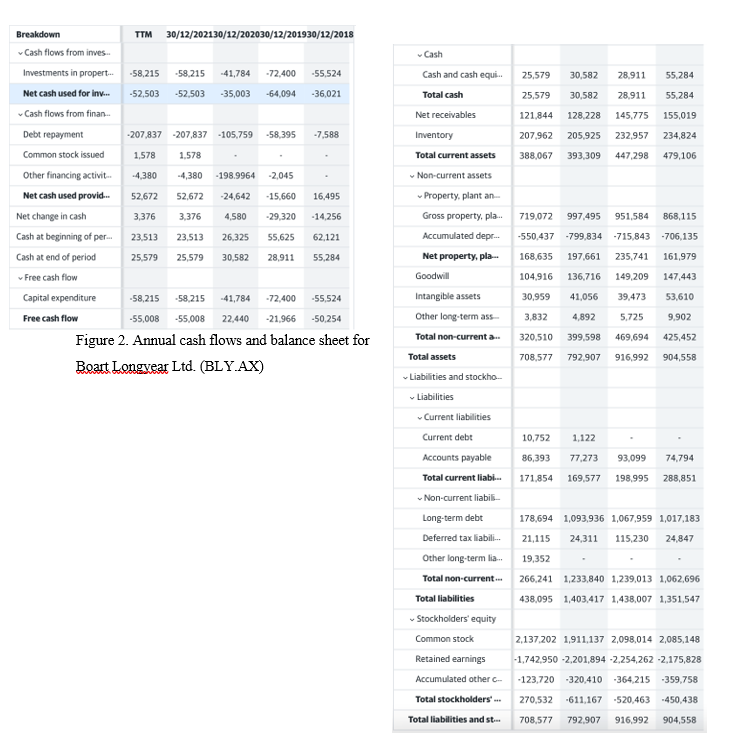
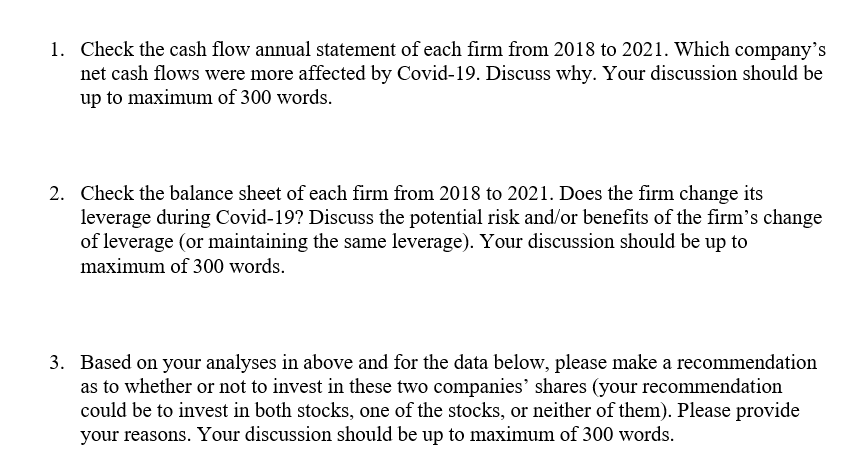
Cash flow TTM 29/6/2021 29/6/2020 29/6/2019 29/6/2018 29/6/2021 29/6/2020 29/6/2019 29/6/2018 Breakdown Assets -4,016 -5.448 - 1,487 -143.98 460.676 Current assets -34.56 -30.638 -50 20.306 29,487 30,107 19,048 7,822 -3,882 -5,326 -1,207 247.392 460.676 Cash Cash and cash equi. Total cash Other current assets 29,487 30.107 19.048 7,822 116,377 18,048 24,567 20,264 8,778 170.076 194.059 160.485 Breakdown Cash flows from inves.. Investments in propert. Purchases of investme. Sales/maturities of in. Net cash used for in... Cash flows from finan.. Common stock issued Common stock repurch Other financing activit. Net cash used provid... Net change in cash Cash at beginning of per... Cash at end of period Free cash flow Capital expenditure Free cash flow -6,140 - 125.565 -1.801 -1,444 -848.108 Total current assets 36,319 34,495 23,424 9,833 -96.93 -76.137 -53.56 -41.143 108,958 17.985 22.707 18.773 7.930 85,456 -621.083 11,063 11.111 3,008 718.885 304.261 299.236 3.898 32,832 30.107 19.048 7,822 4,814 -252.84 -148.637 -66.141 118.289 29.487 30.107 19.048 7,822 466.045 155.624 233.095 3.898 80.638 -4,016 50 -143.98 -5,448 20.306 -1.487 115.198 - 460.676 -23,637 -18,728 - 11.924 -8,053 -4,922 34,893 30,458 7,057 7,057 Non-current assets Property, plant an... Gross property, pla. Accumulated depr... Net property, pla... Equity and other in. Intangible assets Other long-term as... Total non-current a... Total assets Liabilities and stockho... Liabilities Current liabilities Accounts payable Other current liabil... 15.593 15.593 15.593 35,490 30,710 7,356 7,081 71,809 65,205 30,779 16,914 Figure 1. Annual cash flows and balance sheet for Imugene (IMU.AX) 759.725 1,013 1,479 288.507 2,853 1,435 Total current liabi... 4,457 2.899 2.424 438.24 Non-current liabili. Other long-term lia... 2,164 2,489 985.45 985.45 Total non-current... 2,334 2,499 1.061 1,001 6,791 5,399 3,485 1,439 113,107 104,895 63,122 44,286 Total liabilities Stockholders' equity Common stock Retained earnings Accumulated other Total stockholders' ... Total liabilities and st... -65,652 -47,310 -36,817 -29.110 17,563 2,222 988.945 299.945 65,018 59,806 27,295 15,475 71,809 65,205 30,779 16,914 Cash 25,579 30,582 28.911 55.284 25,579 30,582 28.911 55.284 Cash and cash equi.. Total cash Net receivables Inventory 121,844 128.228 145.775 155,019 207,962 205925 232,957 234,824 Total current assets 388,067 393,309 447,298 479,106 Breakdown TTM 30/12/202130/12/202030/12/201930/12/2018 Cash flows from inves.. Investments in propert.. -58,215 -58.215 -41,784 -72.400 -55,524 Net cash used for in... -52,503 -52,503 -35,003 -64,094 -36,021 Cash flows from finan Debt repayment -207,837 -207,837 -105,759 -58,395 -7,588 Common stock issued 1.578 1.578 Other financing activit.. -4,380 -4,380 -198.9964 -2,045 Net cash used provid. 52,672 52.672 -24,642 -15.660 16,495 Net change in cash 3,376 3,376 4,580 -29,320 -14,256 Cash at beginning of per 23,513 23.513 26.325 55,625 62,121 Cash at end of period 25,579 25,579 30,582 28,911 55,284 Free cash flow Capital expenditure -58,215 -58,215 -41,784 -72,400 -55,524 Free cash flow -55,008 -55,008 22,440 -21,966 -50,254 Figure 2. Annual cash flows and balance sheet for Beart Longyear Ltd. (BLY.AX) Non-current assets Property, plant an- Gross property, pla. 719,072 997.495 951,584 868,115 Accumulated depr... -550,437 -799.834 -715,843 -706,135 168,635 197,661 235,741 161,979 104,916 136,716 149,209 147,443 30,959 41,056 39,473 53,610 3,832 4,892 5,725 9.902 320,510 399.598 469,694 425,452 708.577 792,907 916.992 904,558 Net property, pla. Goodwill Intangible assets Other long-term ass Total non-current ... Total assets Liabilities and stockho... Liabilities Current liabilities Current debt Accounts payable Total current liabi... Non-current liabil Long-term debt Deferred tax liabili. Other long-term li... Total non-current... 10,752 1,122 86,393 77,273 93,099 74.794 171,854 169.577 198,995 288,851 178,694 1,093,936 1,067,959 1,017,183 21,115 24,311 115,230 24,847 19,352 266,241 1,233,840 1,239,013 1,062,696 Total liabilities 438,095 1,403,417 1,438,007 1,351,547 2,137,202 1,911,137 2,098,014 2,085,148 Stockholders' equity Common stock Retained earnings Accumulated other c- Total stockholders' ... -1,742,950 -2,201,894 -2,254,262 -2,175,828 -123,720 320,410 -364.215 -359,758 270,532 -611,167 -520,463 .450,438 Total liabilities and st... 708,577 792.907 916,992 904,558 1. Check the cash flow annual statement of each firm from 2018 to 2021. Which company's net cash flows were more affected by Covid-19. Discuss why. Your discussion should be up to maximum of 300 words. 2. Check the balance sheet of each firm from 2018 to 2021. Does the firm change its leverage during Covid-19? Discuss the potential risk and/or benefits of the firm's change of leverage (or maintaining the same leverage). Your discussion should be up to maximum of 300 words. 3. Based on your analyses in above and for the data below, please make a recommendation as to whether or not to invest in these two companies' shares (your recommendation could be to invest in both stocks, one of the stocks, or neither of them). Please provide your reasons. Your discussion should be up to maximum of 300 words. Cash flow TTM 29/6/2021 29/6/2020 29/6/2019 29/6/2018 29/6/2021 29/6/2020 29/6/2019 29/6/2018 Breakdown Assets -4,016 -5.448 - 1,487 -143.98 460.676 Current assets -34.56 -30.638 -50 20.306 29,487 30,107 19,048 7,822 -3,882 -5,326 -1,207 247.392 460.676 Cash Cash and cash equi. Total cash Other current assets 29,487 30.107 19.048 7,822 116,377 18,048 24,567 20,264 8,778 170.076 194.059 160.485 Breakdown Cash flows from inves.. Investments in propert. Purchases of investme. Sales/maturities of in. Net cash used for in... Cash flows from finan.. Common stock issued Common stock repurch Other financing activit. Net cash used provid... Net change in cash Cash at beginning of per... Cash at end of period Free cash flow Capital expenditure Free cash flow -6,140 - 125.565 -1.801 -1,444 -848.108 Total current assets 36,319 34,495 23,424 9,833 -96.93 -76.137 -53.56 -41.143 108,958 17.985 22.707 18.773 7.930 85,456 -621.083 11,063 11.111 3,008 718.885 304.261 299.236 3.898 32,832 30.107 19.048 7,822 4,814 -252.84 -148.637 -66.141 118.289 29.487 30.107 19.048 7,822 466.045 155.624 233.095 3.898 80.638 -4,016 50 -143.98 -5,448 20.306 -1.487 115.198 - 460.676 -23,637 -18,728 - 11.924 -8,053 -4,922 34,893 30,458 7,057 7,057 Non-current assets Property, plant an... Gross property, pla. Accumulated depr... Net property, pla... Equity and other in. Intangible assets Other long-term as... Total non-current a... Total assets Liabilities and stockho... Liabilities Current liabilities Accounts payable Other current liabil... 15.593 15.593 15.593 35,490 30,710 7,356 7,081 71,809 65,205 30,779 16,914 Figure 1. Annual cash flows and balance sheet for Imugene (IMU.AX) 759.725 1,013 1,479 288.507 2,853 1,435 Total current liabi... 4,457 2.899 2.424 438.24 Non-current liabili. Other long-term lia... 2,164 2,489 985.45 985.45 Total non-current... 2,334 2,499 1.061 1,001 6,791 5,399 3,485 1,439 113,107 104,895 63,122 44,286 Total liabilities Stockholders' equity Common stock Retained earnings Accumulated other Total stockholders' ... Total liabilities and st... -65,652 -47,310 -36,817 -29.110 17,563 2,222 988.945 299.945 65,018 59,806 27,295 15,475 71,809 65,205 30,779 16,914 Cash 25,579 30,582 28.911 55.284 25,579 30,582 28.911 55.284 Cash and cash equi.. Total cash Net receivables Inventory 121,844 128.228 145.775 155,019 207,962 205925 232,957 234,824 Total current assets 388,067 393,309 447,298 479,106 Breakdown TTM 30/12/202130/12/202030/12/201930/12/2018 Cash flows from inves.. Investments in propert.. -58,215 -58.215 -41,784 -72.400 -55,524 Net cash used for in... -52,503 -52,503 -35,003 -64,094 -36,021 Cash flows from finan Debt repayment -207,837 -207,837 -105,759 -58,395 -7,588 Common stock issued 1.578 1.578 Other financing activit.. -4,380 -4,380 -198.9964 -2,045 Net cash used provid. 52,672 52.672 -24,642 -15.660 16,495 Net change in cash 3,376 3,376 4,580 -29,320 -14,256 Cash at beginning of per 23,513 23.513 26.325 55,625 62,121 Cash at end of period 25,579 25,579 30,582 28,911 55,284 Free cash flow Capital expenditure -58,215 -58,215 -41,784 -72,400 -55,524 Free cash flow -55,008 -55,008 22,440 -21,966 -50,254 Figure 2. Annual cash flows and balance sheet for Beart Longyear Ltd. (BLY.AX) Non-current assets Property, plant an- Gross property, pla. 719,072 997.495 951,584 868,115 Accumulated depr... -550,437 -799.834 -715,843 -706,135 168,635 197,661 235,741 161,979 104,916 136,716 149,209 147,443 30,959 41,056 39,473 53,610 3,832 4,892 5,725 9.902 320,510 399.598 469,694 425,452 708.577 792,907 916.992 904,558 Net property, pla. Goodwill Intangible assets Other long-term ass Total non-current ... Total assets Liabilities and stockho... Liabilities Current liabilities Current debt Accounts payable Total current liabi... Non-current liabil Long-term debt Deferred tax liabili. Other long-term li... Total non-current... 10,752 1,122 86,393 77,273 93,099 74.794 171,854 169.577 198,995 288,851 178,694 1,093,936 1,067,959 1,017,183 21,115 24,311 115,230 24,847 19,352 266,241 1,233,840 1,239,013 1,062,696 Total liabilities 438,095 1,403,417 1,438,007 1,351,547 2,137,202 1,911,137 2,098,014 2,085,148 Stockholders' equity Common stock Retained earnings Accumulated other c- Total stockholders' ... -1,742,950 -2,201,894 -2,254,262 -2,175,828 -123,720 320,410 -364.215 -359,758 270,532 -611,167 -520,463 .450,438 Total liabilities and st... 708,577 792.907 916,992 904,558 1. Check the cash flow annual statement of each firm from 2018 to 2021. Which company's net cash flows were more affected by Covid-19. Discuss why. Your discussion should be up to maximum of 300 words. 2. Check the balance sheet of each firm from 2018 to 2021. Does the firm change its leverage during Covid-19? Discuss the potential risk and/or benefits of the firm's change of leverage (or maintaining the same leverage). Your discussion should be up to maximum of 300 words. 3. Based on your analyses in above and for the data below, please make a recommendation as to whether or not to invest in these two companies' shares (your recommendation could be to invest in both stocks, one of the stocks, or neither of them). Please provide your reasons. Your discussion should be up to maximum of 300 words