Answered step by step
Verified Expert Solution
Question
1 Approved Answer
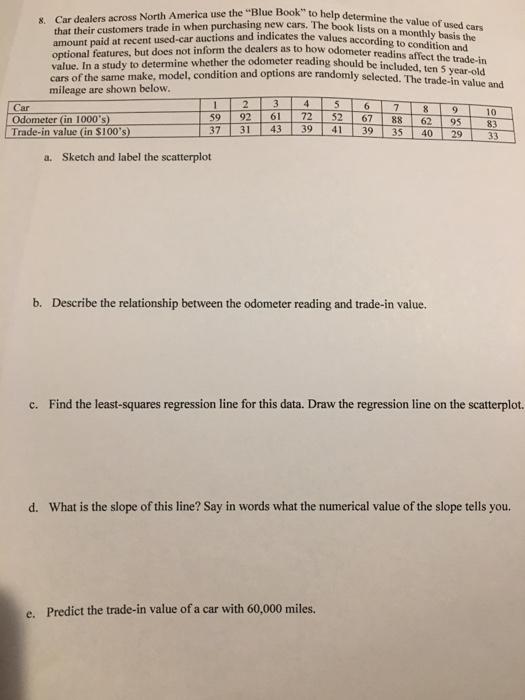
that their customers trade in when purchasing new cars. The book lists on a monthly basis the amount paid at recent used-car auctions and

that their customers trade in when purchasing new cars. The book lists on a monthly basis the amount paid at recent used-car auctions and indicates the values according to condition and 8. Car dealers across North America use the "Blue Book" to help determine the value of used cars optional features, but does not inforim the dcalers as to now odometer readins affect the trnde in value, In a study to determine whether the odometer reading should be included ten Sde- cars of the same make, model, condition and options are randomly selected. The trade-in value and mileage are shown below. 3. 4 Car 8 9 10 Odometer (in 1000's) Trade-in value (in S100's) 59 92 61 72 52 67 88 62 95 83 37 31 43 39 41 39 35 40 29 33 a. Sketch and label the scatterplot b. Describe the relationship between the odometer reading and trade-in value. c. Find the least-squares regression line for this data. Draw the regression line on the scatterplot. d. What is the slope of this line? Say in words what the numerical value of the slope tells you. c. Predict the trade-in value of a car with 60,000 miles.
Step by Step Solution
★★★★★
3.38 Rating (145 Votes )
There are 3 Steps involved in it
Step: 1
Answer solubion a contruct the scatter plot Excel instruction 1 amport ...
Get Instant Access to Expert-Tailored Solutions
See step-by-step solutions with expert insights and AI powered tools for academic success
Step: 2

Step: 3

Ace Your Homework with AI
Get the answers you need in no time with our AI-driven, step-by-step assistance
Get Started


