

Answered step by step
Verified Expert Solution
Question
1 Approved Answer
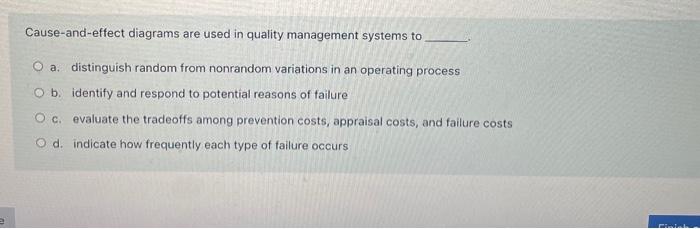
Cause-and-effect diagrams are used in quality management systems to O a. distinguish random from nonrandom variations in an operating process Ob identify and respond to
Step by Step Solution
There are 3 Steps involved in it
Step: 1

Get Instant Access to Expert-Tailored Solutions
See step-by-step solutions with expert insights and AI powered tools for academic success
Step: 2

Step: 3
Ace Your Homework with AI
Get the answers you need in no time with our AI-driven, step-by-step assistance
Get Started
International Financial Reporting Standards A Practical Guide
Authors: Hennie Van Greuning, Darrel Scott, Simonet Terblanche
6th Edition
0821384287, 978-0821384282