

Answered step by step
Verified Expert Solution
Question
1 Approved Answer
Cell Phone Cases Sold graph and the equation show a linear model for data collected on the number of cell phones and cell phone
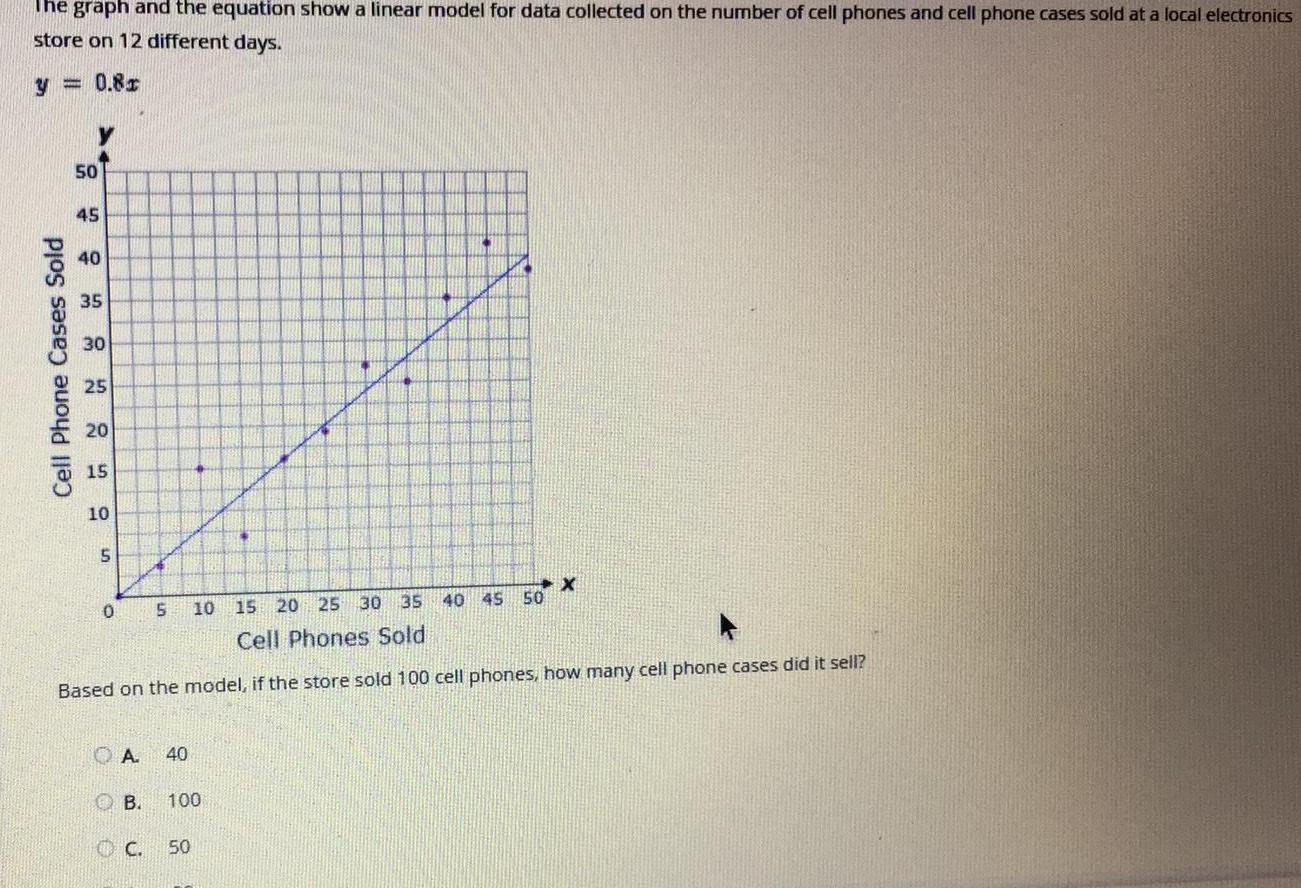
Cell Phone Cases Sold graph and the equation show a linear model for data collected on the number of cell phones and cell phone cases sold at a local electronics store on 12 different days. y = 0.8 50 45 40 35 30 25 20 15 10 5 0 5 10 15 20 25 Cell Phones Sold 30 35 40 45 50 Based on the model, if the store sold 100 cell phones, how many cell phone cases did it sell? OA 40 B. 100 C. 50
Step by Step Solution
There are 3 Steps involved in it
Step: 1

Get Instant Access to Expert-Tailored Solutions
See step-by-step solutions with expert insights and AI powered tools for academic success
Step: 2

Step: 3
Ace Your Homework with AI
Get the answers you need in no time with our AI-driven, step-by-step assistance
Get Started
Surfaces In Classical Geometries A Treatment By Moving Frames
Authors: Gary R Jensen, Emilio Musso, Lorenzo Nicolodi
1st Edition
3319270761, 9783319270760