Question
Cereal bar manufacturer Carman's kitchen offers premium cereal bars in five different flavors under the brand name Carman's. Despite being a small firm, Carman's kitchen
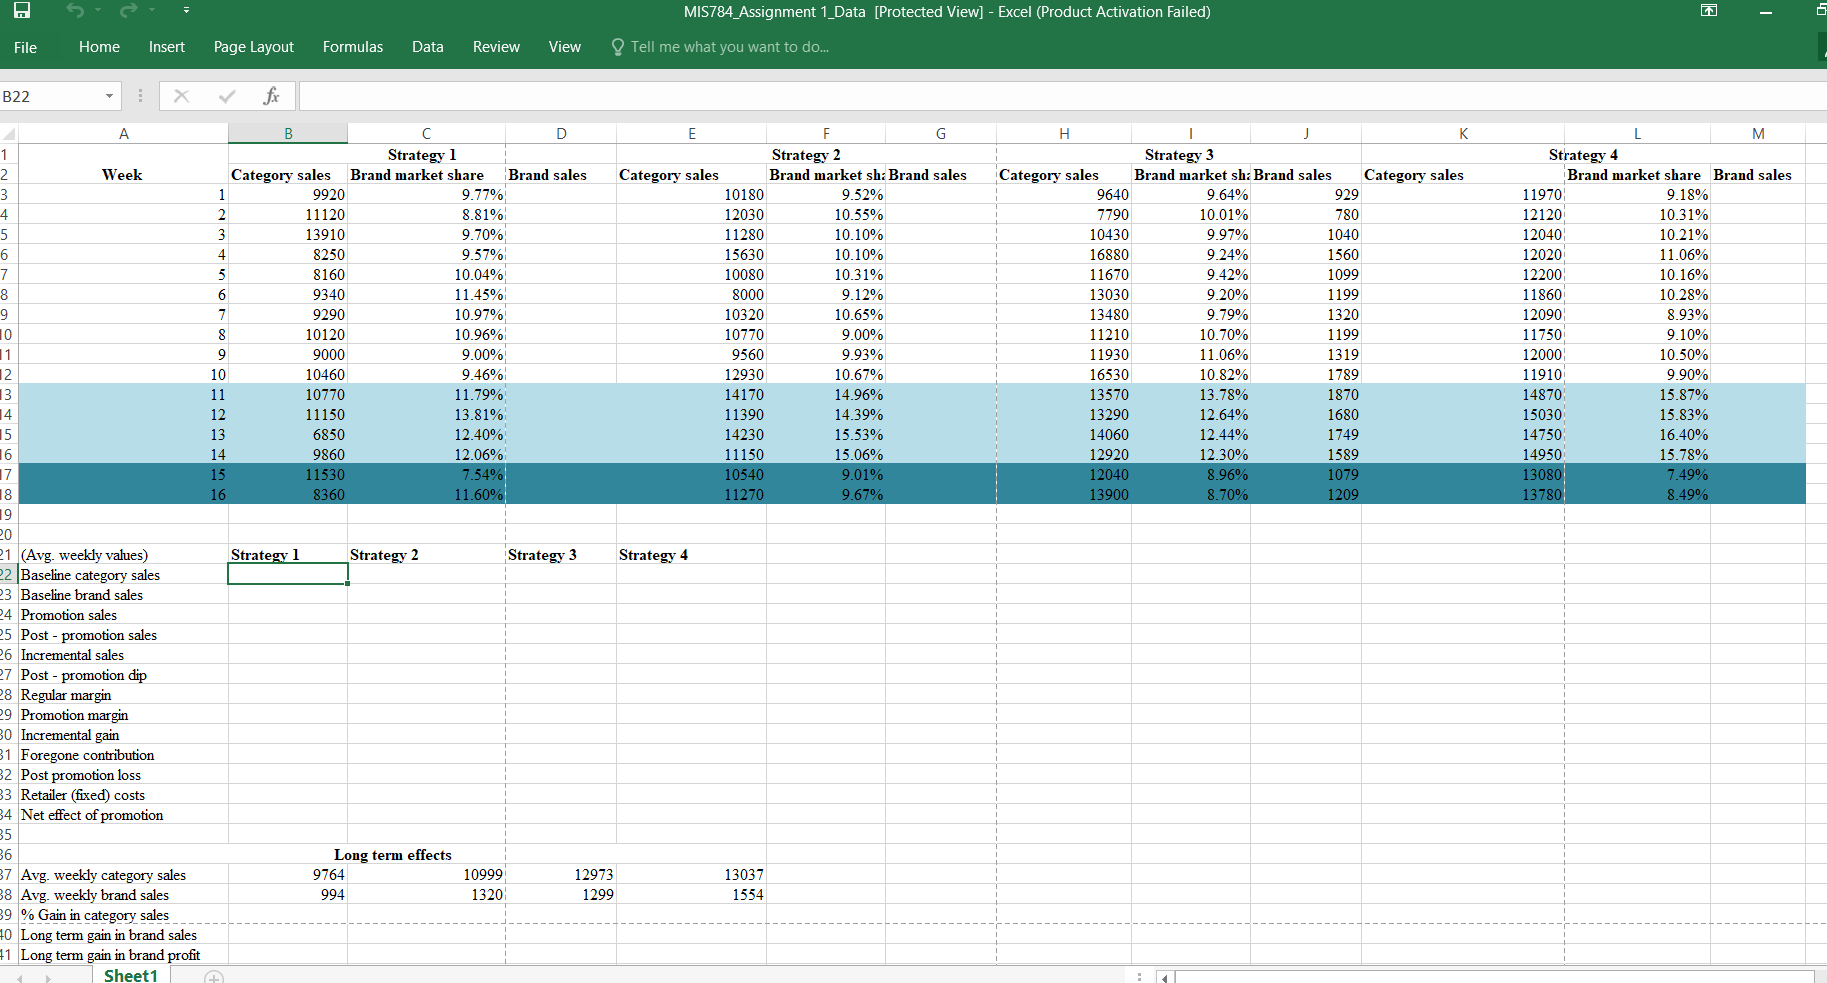
Cereal bar manufacturer Carman's kitchen offers premium cereal bars in five different flavors under the brand name "Carman's". Despite being a small firm, Carman's kitchen has managed to get about 20% market share in the cereal bars category, which is dominated by larger players such as Kellogs and Uncle Tobys. Carman's kitchen is pursuing an aggressive growth strategy and is planning to use price promotions extensively. The company has hired you as its marketing consultant to help identify the best price promotion strategy to pursue. Carman's has identified four different price promotion strategies that it can offer. Details of these strategies are given in the table below. Regular price of Carman's cereal bar is $5 and its regular margin (contribution) is $3. Carman's has to cover any additional cost that the retailer will incur in running the promotion.
To evaluate which of these strategies is effective, Carman's conducted field experiments in four stores (one strategy per store) of a major Australian supermarket chain during the past 26 weeks. In these field experiments, one of the four promotions was offered in weeks 11-14 and the category sales and Carman's brand market share were observed for 10 weeks prior to promotion and 12 weeks after promotion. Post-promotion dip was observed for 2 weeks following the promotional period, after which sales returned to its baseline value or persisted higher than the baseline value. The provided Excel file contains the weekly category sales and brand market share for the 10 week pre-promotion period, 4 week promotion period (highlighted in light blue) and two week post promotion period (highlighted in dark blue). Long-term weekly average category sales and brand market shares (evaluated during 10 weeks after post-promotion dip period) are also given in the data. You can assume that the four experimental stores are comparable in terms of their store characteristics as well as the demographic characteristics of its customers. Your task is to evaluate the net impact of promotion taking into account any retailer's cost and long-term impact on category sales and brand market share; and recommend the best promotion strategy for Carman's. Discuss your intuition for the observed results and provide justification for your recommendation.
STRATEGY TABLES
Strategy Promotional price Weekly retailer cost per store
10% price reduction $4.5 0
20% price reduction $4 0
10% price reduction with end of aisle display $4.5 $300
20% price reduction with feature in weekly catalogue $4 $100
PLEASE COMPLETED EXCEL TABLE AS WELL

Step by Step Solution
There are 3 Steps involved in it
Step: 1

Get Instant Access to Expert-Tailored Solutions
See step-by-step solutions with expert insights and AI powered tools for academic success
Step: 2

Step: 3

Ace Your Homework with AI
Get the answers you need in no time with our AI-driven, step-by-step assistance
Get Started


