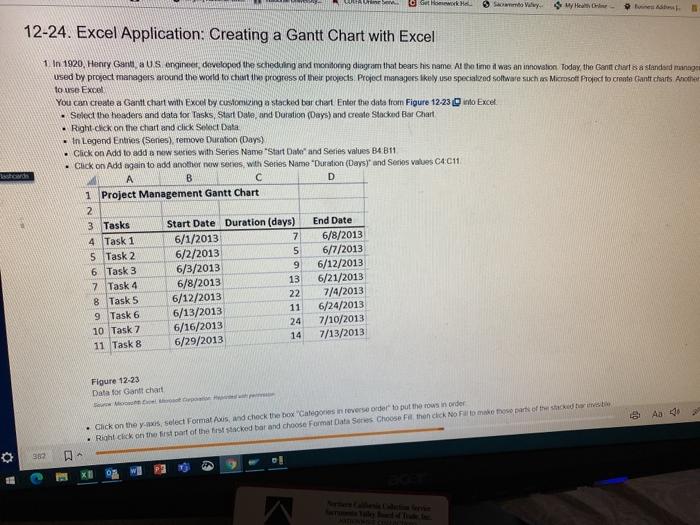
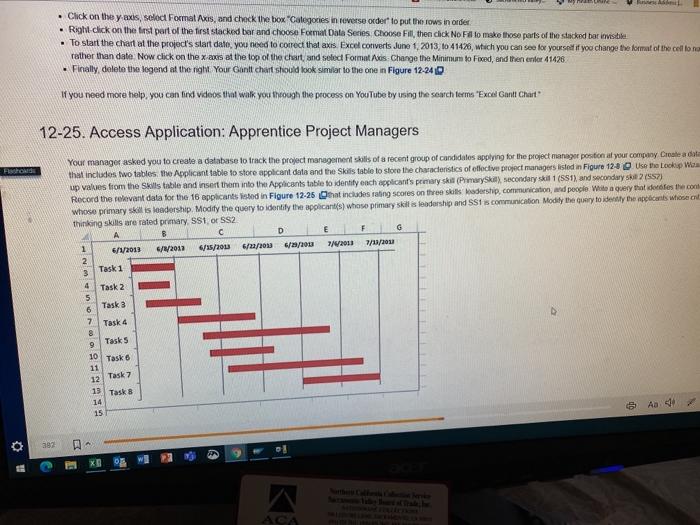
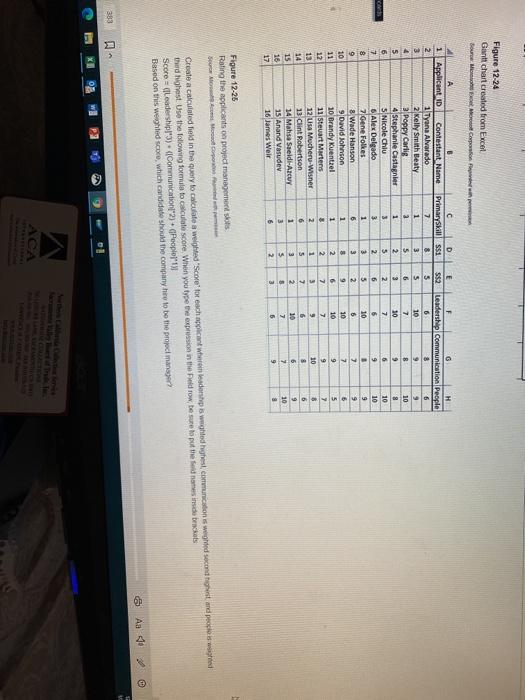
Cet How Show 12-24. Excel Application: Creating a Gantt Chart with Excel 1 In 1920, Henry Garva US engineer developed the scheduling and monitoring diagram that bears his name. Al the time it was an innovation. Today, the Gant chut sa standardnog used by project managers around the would to chant de progress of their projects Project managers likely uso specialized software such as Microsoft Project to create Gantt Charts Another to use Excel You can create a Gantt chart with Excel by customing a stacked barchard Enter the data from Figure 12-23 no Excel Select the headers and data for Tasks. Start Date and Duration (Days) and create Stacked Bar Chart Right click on the chart and click Select Data . In Legend Entries (Senes), remove Duration (Days) - Click on Add to add a new series with Series Name "Start Date and Series values B4 B11 . Cack on Add again to add another new series with Series Name "Duration (Days and Series values C4C11 A B D 1 Project Management Gantt Chart 2 3 Tasks Start Date Duration (days) End Date 4 Task 1 6/1/2013 7 6/8/2013 5 Task 2 6/2/2013 5 6/7/2013 6 Task 3 6/3/2013 9 6/12/2013 7 Task 4 6/8/2013 13 6/21/2013 8 Task 5 6/12/2013 22 7/4/2013 9 Task 6 6/13/2013 11 6/24/2013 10 Task 7 6/16/2013 24 7/10/2013 14 11 Task 8 6/29/2013 7/13/2013 Figure 12-23 Data for Gantt chart Shop A 30 . Click on the yaxis, select Formats and check the box Categories in reverse order to put the rows in order . Right click on the first part of the first stacked bar and choose Format Data Series Choose then click No Fear of the studenti 382 RAL . Click on the yaxis, solot Format Axis, and check the box Categories in reverse order to put the rows in order . Right click on the first part of the first stacked bar and choose Format Data Series Choose Fill, then click No Fllo make those parts of the stacked bar invisibile . To start the chart at the project's start date, you need to correct that axis Excel converts June 1, 2013, to 41426, which you can see for yourse if you change the format of the cell tono rather thandate Now click on the x ans at the top of the chart and select Format Aus Change the Minimum to Fixed, and then enler 41428 - Finally delete the legend at the night Your Gantt chat should look similar to the one in Figure 12-24D If you need more help, you can find videos that walk you through the process on YouTube by using the search terms "ExceGantt Chart 12-25. Access Application: Apprentice Project Managers Fodu Your manager asked you to create a database to track the project management skills of a recent group of candidates applying for the project manager position at your company Create a data that includes two tables, the Applicant table to store applicant dels and the skills table to store the characteristics of offective project managers ested in Figure 128 Use the Lookup Wan up values from the Skills table and insert them into the Applicants table to identify each applicant's peeneryski (Primary Skil), secondary skill 1 (551), and secondary ske 21957) Record the relevant data for the 16 applicants listed in Figure 12-25 that includes rating scores on three skills Hadership, communication, and people Wito a sety that does the con whose primary skill is leadership. Modify the query to identify the applicants whose primary skill is leadership and SS1 is communication Modify the Gery to idently the cars wie on Thinking skills are rated primary SS1. SS2 B C D E F G 1 6/1/2013 6/9/2013 6/15/2013 6/22/2018 6/23/200 7/2011 7/12/2011 2 3 Task 1 4 Task 2 5 6 Task 3 7 Task 4 8 9 Tasks 10 Task 6 11 12 Task 7 13 Tasks 14 15 0 Figure 12-24 Gantt chat created from Excel Surpose E 552 5 5 D Primary Skill 551 7 8 1 3 2 S 1 2 3 5 3 2 1 3 6 3 1 1. Applicant ID Contestant Name 2 1 Tyana Alvarado 3 2 Kelly Smith Beaty 4 a poppy Carlig s 4 Stephanie Castagnier 6 S Nicole Chiu 2 6 Alex Delgado Zene Folkes 8 Wade Hanson 10 9 David Johnson 11 10 Brandy Kuentzel 12 11 Steuart Moters 13 12 Lisa Mucheru Wisner 14 13 Clint Robertson 15 14 Mahsa Sueldi-ATVY 18 15 Anand Vasudev 17 16 James Weir G 3 2 6 5 2 G Leadership Communication People 6 8 6 10 9 7 8 10 30 9 8 7 6 10 6 9 10 10 9 6 2 9 10 7 6 10 9 5 7 9 7 10 8 6 8 6 10 6 9 7 7 10 5 9 8 2 2 7 1 3 2 6 1 3 6 3 7 1 5 3 $ 2 2 3 Figure 12-25 Rating the applicants on project management skills Scoop Create a calculated field in the query to calculate a weighted Score for each applicant where do weighted highest communication is weghe second hand pocket the highest Use the following formula to calculate score. When you type te expression in the eldrow, be sure to put the fedes inside bricks Score = Leadership '3) - (Communication 2) (Peoplo Based on this weighted coco, which candidate should the company hire to be the project manager 6 Aa 70 383 ACA