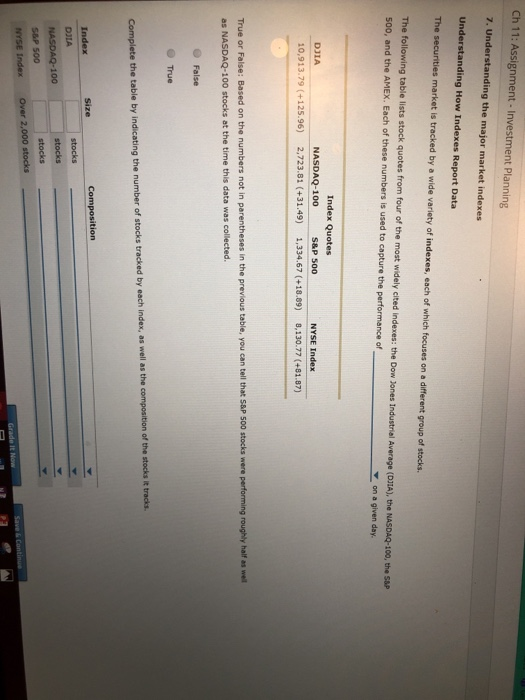
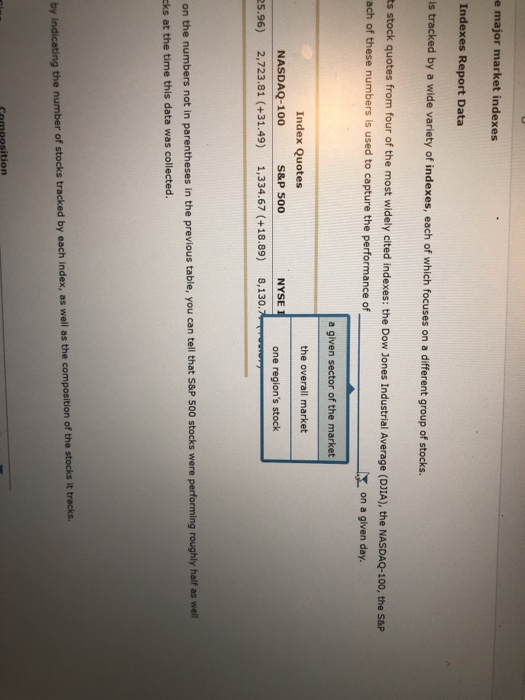
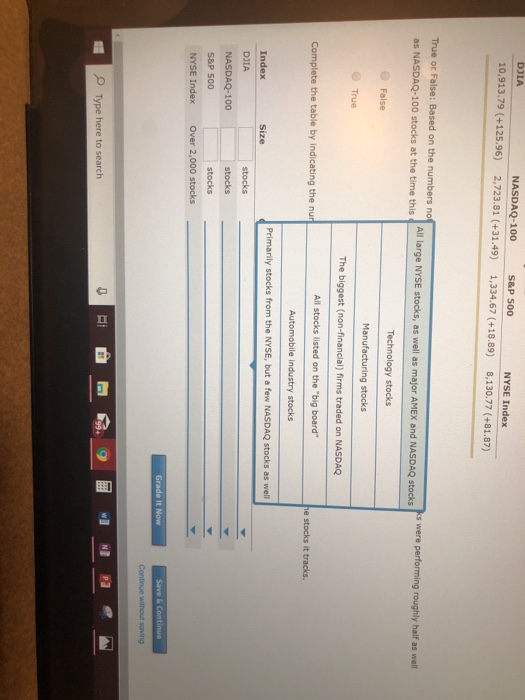
Ch 11: Assignment- Investment Planning 7. Understanding the major market indexes Understanding How Indexes Report Data The securities market is tracked by a wide variety of indexes, each of which focuses on a different group of stocks The following table lists stock quotes from four of the most widely cited indexes: the Dow Jones Industrial Average (DIA), the NASDAQ-100, the S&P 500, and the AMEX. Each of these numbers is used to capture the performance of on a given day Index Quotes DJIA NASDAQ-100 S&P 500 NYSE Index 10,913.79 (+125.96) 2,723.81 (+31.49) 1,334.67 (+18.89) 8,130.77 (+81.87) True or False: Based on the numbers not in parentheses in the previous table, you can tell that S&P 500 stocks were performing roughly half as well as NASDAQ-100 stocks at the time this data was collected. False True Complete the table by indicating the number of stocks tracked by each index, as well as the composition of the stocks it tracks Size Composition Index stocks DJIA stocks NASDAQ-100 stocks S&P 500 NYSE Index Over 2,000 stocks Save & Continuel Grade It Now e major market indexes Indexes Report Data is tracked by a wide variety of indexes, each of which focuses on a different group of stocks. ts stock quotes from four of the most widely cited indexes: the Dow Jones Industrial Average (DJIA), the NASDAQ-100, the S&P ach of these numbers is used to capture the performance of on a given day. a given sector of the market the overall market Index Quotes NASDAQ-100 S&P 500 NYSE I one region's stock 25.96) 2,723.81 (+31.49) 1,334.67 (+18.89) 8,130.7 performing roughly half as well on the numbers not in parentheses in the previous table, you can tell that S&P 500 stocks were cks at the time this data was collected. by indicating the number of stocks tracked by each index, as well as the composition of the stocks it tracks. nosition DJIA NASDAQ-100 S&P 500 NYSE Index 10,913.79 (+125.96) 2,723.81 (+31.49) 1,334.67 (+18.89) 8,130.77 (+81.87) True or False: Based on the numbers not All large NYSE stocks, as well as major AMEX and NASDAQ stocks ks were performing roughly half as well as NASDAQ-100 stocks at the time this Technology stocks False Manufacturing stocks True The biggest (non-financial) firms traded on NASDAQ All stocks lilsted on the "big board" Complete the table by indicating the nur he stocks it tracks. Automobile industry stocks Primarily stocks from the NYSE, but a few NASDAQ stocks as well Index Size DJIA stocks NASDAQ-100 stocks S&P 500 stocks NYSE Index Over 2,000 stocks Save & Continue Grade It Now Continue without saving N OType here to search


