

Answered step by step
Verified Expert Solution
Question
1 Approved Answer
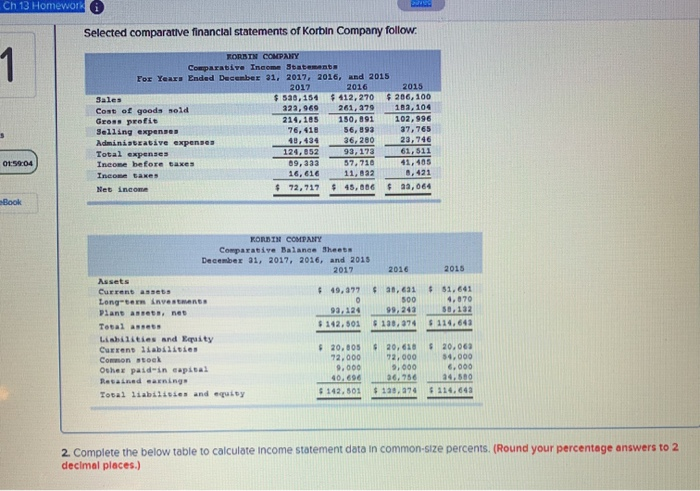
Ch 13 Homework Selected comparative financial statements of Korbin Company follow. KORSTN COMPANY Comparative Income Statements For Year Ended December 31, 2017, 2016, and 2015
Step by Step Solution
There are 3 Steps involved in it
Step: 1

Get Instant Access to Expert-Tailored Solutions
See step-by-step solutions with expert insights and AI powered tools for academic success
Step: 2

Step: 3
Ace Your Homework with AI
Get the answers you need in no time with our AI-driven, step-by-step assistance
Get Started
Marketing Audit Reports Get An Extensive List Of 130 Marketing Audit Reports
Authors: Jack Chalow
1st Edition
B0BQXYKYZJ, 979-8371063076