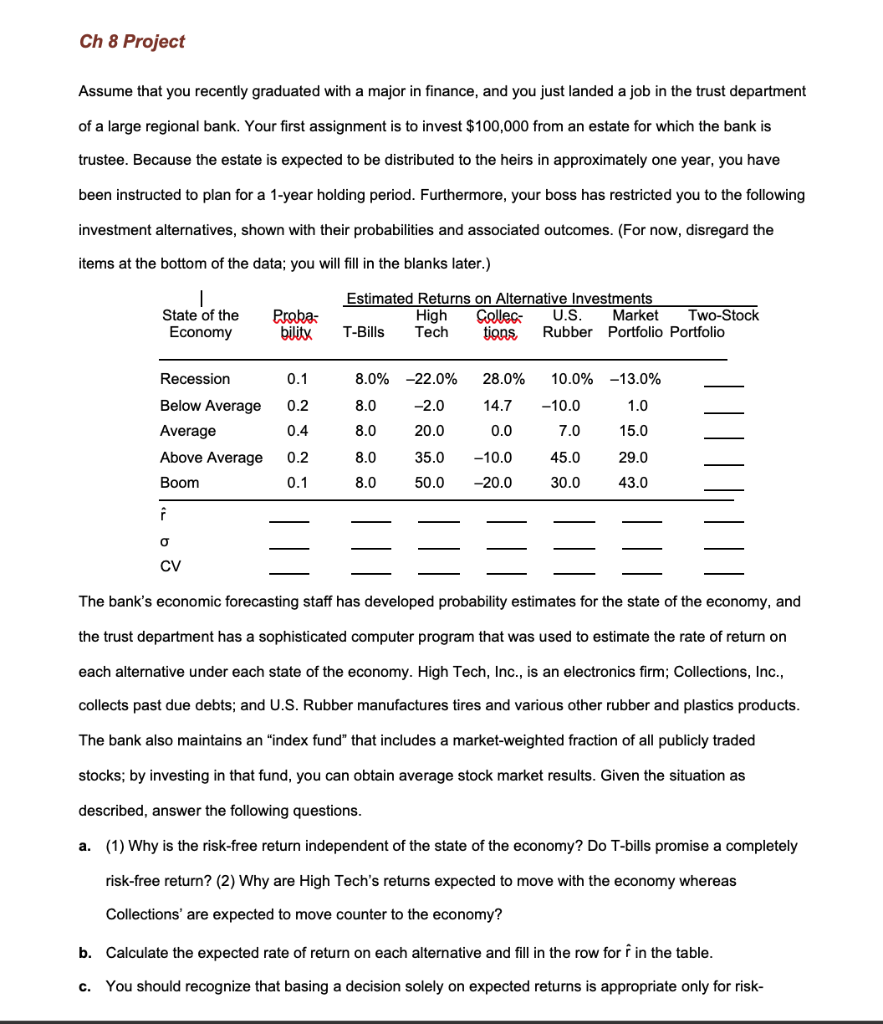
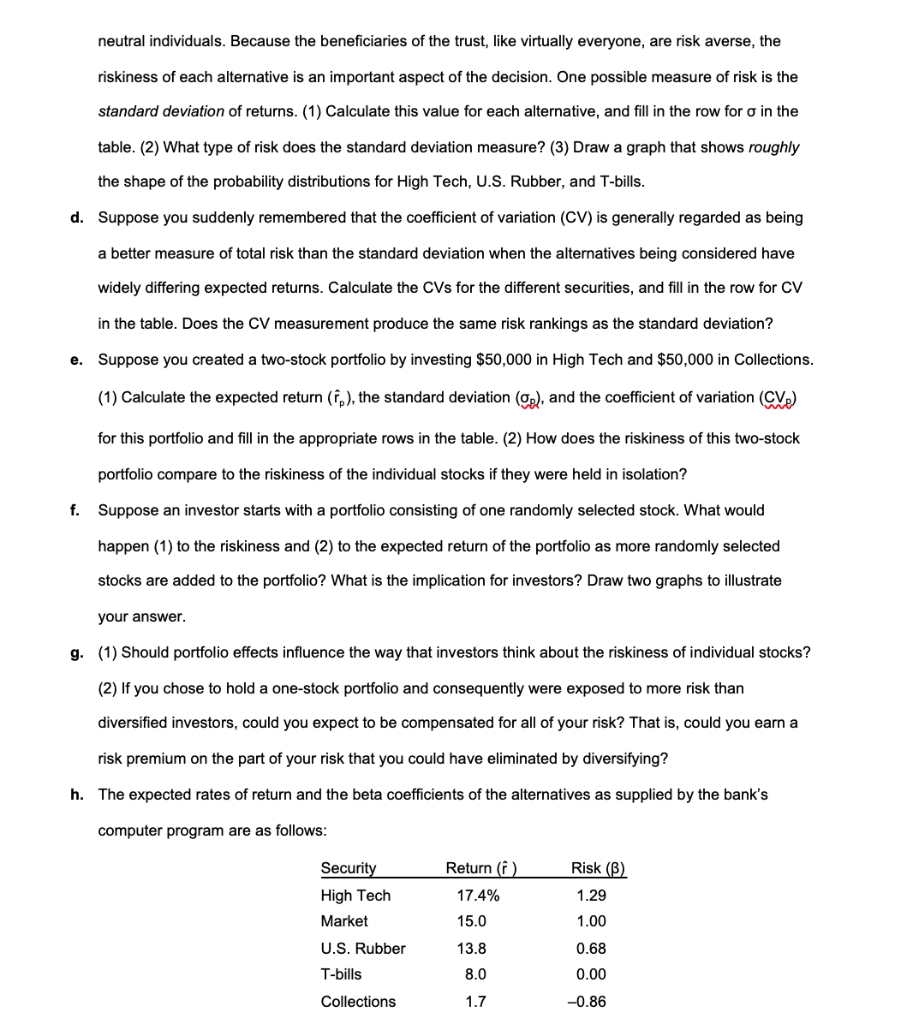
Ch 8 Project Assume that you recently graduated with a major in finance, and you just landed a job in the trust department of a large regional bank. Your first assignment is to invest $100,000 from an estate for which the bank is trustee. Because the estate is expected to be distributed to the heirs in approximately one year, you have been instructed to plan for a 1-year holding period. Furthermore, your boss has restricted you to the following investment alternatives, shown with their probabilities and associated outcomes. (For now, disregard the items at the bottom of the data; you will fill in the blanks later.) State of the Economy Proba: bility Estimated Returns on Alternative Investments High Collec: U.S. Market Two-Stock T-Bills T ech tions, Rubber Portfolio Portfolio Recession Below Average Average Above Average Boom 0.1 0.2 0.4 0.2 0.1 8.0% 8.0 8.0 8.0 8.0 -22.0% -2.0 20.0 35.0 50.0 28.0% 14.7 0.0 -10.0 -20.0 0.0% -10.0 7.0 45.0 30.0 -13.0% 1.0 15.0 29.0 43.0 The bank's economic forecasting staff has developed probability estimates for the state of the economy, and the trust department has a sophisticated computer program that was used to estimate the rate of return on each alternative under each state of the economy. High Tech, Inc., is an electronics firm; Collections, Inc., collects past due debts; and U.S. Rubber manufactures tires and various other rubber and plastics products. The bank also maintains an "index fund" that includes a market-weighted fraction of all publicly traded stocks; by investing in that fund, you can obtain average stock market results. Given the situation as described, answer the following questions. a. (1) Why is the risk-free return independent of the state of the economy? Do T-bills promise a completely risk-free return? (2) Why are High Tech's returns expected to move with the economy whereas Collections' are expected to move counter to the economy? b. Calculate the expected rate of return on each alternative and fill in the row for r in the table. C. You should recognize that basing a decision solely on expected returns is appropriate only for risk- neutral individuals. Because the beneficiaries of the trust, like virtually everyone, are risk averse, the riskiness of each alternative is an important aspect of the decision. One possible measure of risk is the standard deviation of returns. (1) Calculate this value for each alternative, and fill in the row for o in the table. (2) What type of risk does the standard deviation measure? (3) Draw a graph that shows roughly the shape of the probability distributions for High Tech, U.S. Rubber, and T-bills. d. Suppose you suddenly remembered that the coefficient of variation (CV) is generally regarded as being a better measure of total risk than the standard deviation when the alternatives being considered have widely differing expected returns. Calculate the CVs for the different securities, and fill in the row for CV in the table. Does the CV measurement produce the same risk rankings as the standard deviation? e. Suppose you created a two-stock portfolio by investing $50,000 in High Tech and $50,000 in Collections. (1) Calculate the expected return (fe), the standard deviation (p), and the coefficient of variation (CV) for this portfolio and fill in the appropriate rows in the table. (2) How does the riskiness of this two-stock portfolio compare to the riskiness of the individual stocks if they were held in isolation? Suppose an investor starts with a portfolio consisting of one randomly selected stock. What would happen (1) to the riskiness and (2) to the expected return of the portfolio as more randomly selected stocks are added to the portfolio? What is the implication for investors? Draw two graphs to illustrate your answer. g. (1) Should portfolio effects influence the way that investors think about the riskiness of individual stocks? (2) If you chose to hold a one-stock portfolio and consequently were exposed to more risk than diversified investors, could you expect to be compensated for all of your risk? That is, could you earn a risk premium on the part of your risk that you could have eliminated by diversifying? h. The expected rates of return and the beta coefficients of the alternatives as supplied by the bank's computer program are as follows: Return () 17.4% 15.0 Security High Tech Market U.S. Rubber T-bills Collections Risk (B) 1.29 1.00 0.68 13.8 8.0 0.00 -0.86 appear to be related to each alternative's market risk? (3) Is it possible to choose among the alternatives on the basis of the information developed thus far? Use the data given at the beginning of the problem to construct a graph that shows how the T-bill's, High Tech's, and Collections' beta coefficients are calculated. Discuss what beta measures and explain how it is used in risk analysis. (1) Write out the SML equation, use it to calculate the required rate of return on each alternative, and then graph the relationship between the expected and required rates of return. (2) How do the expected rates of return compare with the required rates of return? (3) Does the fact that Collections has a negative beta coefficient make any sense? What is the implication of the negative beta? (4) What would be the market risk and the required return of a 50-50 portfolio of High Tech and Collections? Of a 50-50 portfolio of High Tech and U.S. Rubber? j. (1) Suppose investors raised their inflation expectations by three percentage points over current estimates as reflected in the 8% T-bill rate. What effect would higher inflation have on the SML and on the returns required on high- and low-risk securities? (2) Suppose instead that investors' risk aversion increased enough to cause the market risk premium to increase by three percentage points. (Inflation remains constant.) What effect would this change have on the SML and on returns of high- and low-risk securities? Ch 8 Project Assume that you recently graduated with a major in finance, and you just landed a job in the trust department of a large regional bank. Your first assignment is to invest $100,000 from an estate for which the bank is trustee. Because the estate is expected to be distributed to the heirs in approximately one year, you have been instructed to plan for a 1-year holding period. Furthermore, your boss has restricted you to the following investment alternatives, shown with their probabilities and associated outcomes. (For now, disregard the items at the bottom of the data; you will fill in the blanks later.) State of the Economy Proba: bility Estimated Returns on Alternative Investments High Collec: U.S. Market Two-Stock T-Bills T ech tions, Rubber Portfolio Portfolio Recession Below Average Average Above Average Boom 0.1 0.2 0.4 0.2 0.1 8.0% 8.0 8.0 8.0 8.0 -22.0% -2.0 20.0 35.0 50.0 28.0% 14.7 0.0 -10.0 -20.0 0.0% -10.0 7.0 45.0 30.0 -13.0% 1.0 15.0 29.0 43.0 The bank's economic forecasting staff has developed probability estimates for the state of the economy, and the trust department has a sophisticated computer program that was used to estimate the rate of return on each alternative under each state of the economy. High Tech, Inc., is an electronics firm; Collections, Inc., collects past due debts; and U.S. Rubber manufactures tires and various other rubber and plastics products. The bank also maintains an "index fund" that includes a market-weighted fraction of all publicly traded stocks; by investing in that fund, you can obtain average stock market results. Given the situation as described, answer the following questions. a. (1) Why is the risk-free return independent of the state of the economy? Do T-bills promise a completely risk-free return? (2) Why are High Tech's returns expected to move with the economy whereas Collections' are expected to move counter to the economy? b. Calculate the expected rate of return on each alternative and fill in the row for r in the table. C. You should recognize that basing a decision solely on expected returns is appropriate only for risk- neutral individuals. Because the beneficiaries of the trust, like virtually everyone, are risk averse, the riskiness of each alternative is an important aspect of the decision. One possible measure of risk is the standard deviation of returns. (1) Calculate this value for each alternative, and fill in the row for o in the table. (2) What type of risk does the standard deviation measure? (3) Draw a graph that shows roughly the shape of the probability distributions for High Tech, U.S. Rubber, and T-bills. d. Suppose you suddenly remembered that the coefficient of variation (CV) is generally regarded as being a better measure of total risk than the standard deviation when the alternatives being considered have widely differing expected returns. Calculate the CVs for the different securities, and fill in the row for CV in the table. Does the CV measurement produce the same risk rankings as the standard deviation? e. Suppose you created a two-stock portfolio by investing $50,000 in High Tech and $50,000 in Collections. (1) Calculate the expected return (fe), the standard deviation (p), and the coefficient of variation (CV) for this portfolio and fill in the appropriate rows in the table. (2) How does the riskiness of this two-stock portfolio compare to the riskiness of the individual stocks if they were held in isolation? Suppose an investor starts with a portfolio consisting of one randomly selected stock. What would happen (1) to the riskiness and (2) to the expected return of the portfolio as more randomly selected stocks are added to the portfolio? What is the implication for investors? Draw two graphs to illustrate your answer. g. (1) Should portfolio effects influence the way that investors think about the riskiness of individual stocks? (2) If you chose to hold a one-stock portfolio and consequently were exposed to more risk than diversified investors, could you expect to be compensated for all of your risk? That is, could you earn a risk premium on the part of your risk that you could have eliminated by diversifying? h. The expected rates of return and the beta coefficients of the alternatives as supplied by the bank's computer program are as follows: Return () 17.4% 15.0 Security High Tech Market U.S. Rubber T-bills Collections Risk (B) 1.29 1.00 0.68 13.8 8.0 0.00 -0.86 appear to be related to each alternative's market risk? (3) Is it possible to choose among the alternatives on the basis of the information developed thus far? Use the data given at the beginning of the problem to construct a graph that shows how the T-bill's, High Tech's, and Collections' beta coefficients are calculated. Discuss what beta measures and explain how it is used in risk analysis. (1) Write out the SML equation, use it to calculate the required rate of return on each alternative, and then graph the relationship between the expected and required rates of return. (2) How do the expected rates of return compare with the required rates of return? (3) Does the fact that Collections has a negative beta coefficient make any sense? What is the implication of the negative beta? (4) What would be the market risk and the required return of a 50-50 portfolio of High Tech and Collections? Of a 50-50 portfolio of High Tech and U.S. Rubber? j. (1) Suppose investors raised their inflation expectations by three percentage points over current estimates as reflected in the 8% T-bill rate. What effect would higher inflation have on the SML and on the returns required on high- and low-risk securities? (2) Suppose instead that investors' risk aversion increased enough to cause the market risk premium to increase by three percentage points. (Inflation remains constant.) What effect would this change have on the SML and on returns of high- and low-risk securities