

Answered step by step
Verified Expert Solution
Question
1 Approved Answer
Change the name of the product worksheet to q 4 . Position the worksheet sequentially in your workbook. In the space allocated above
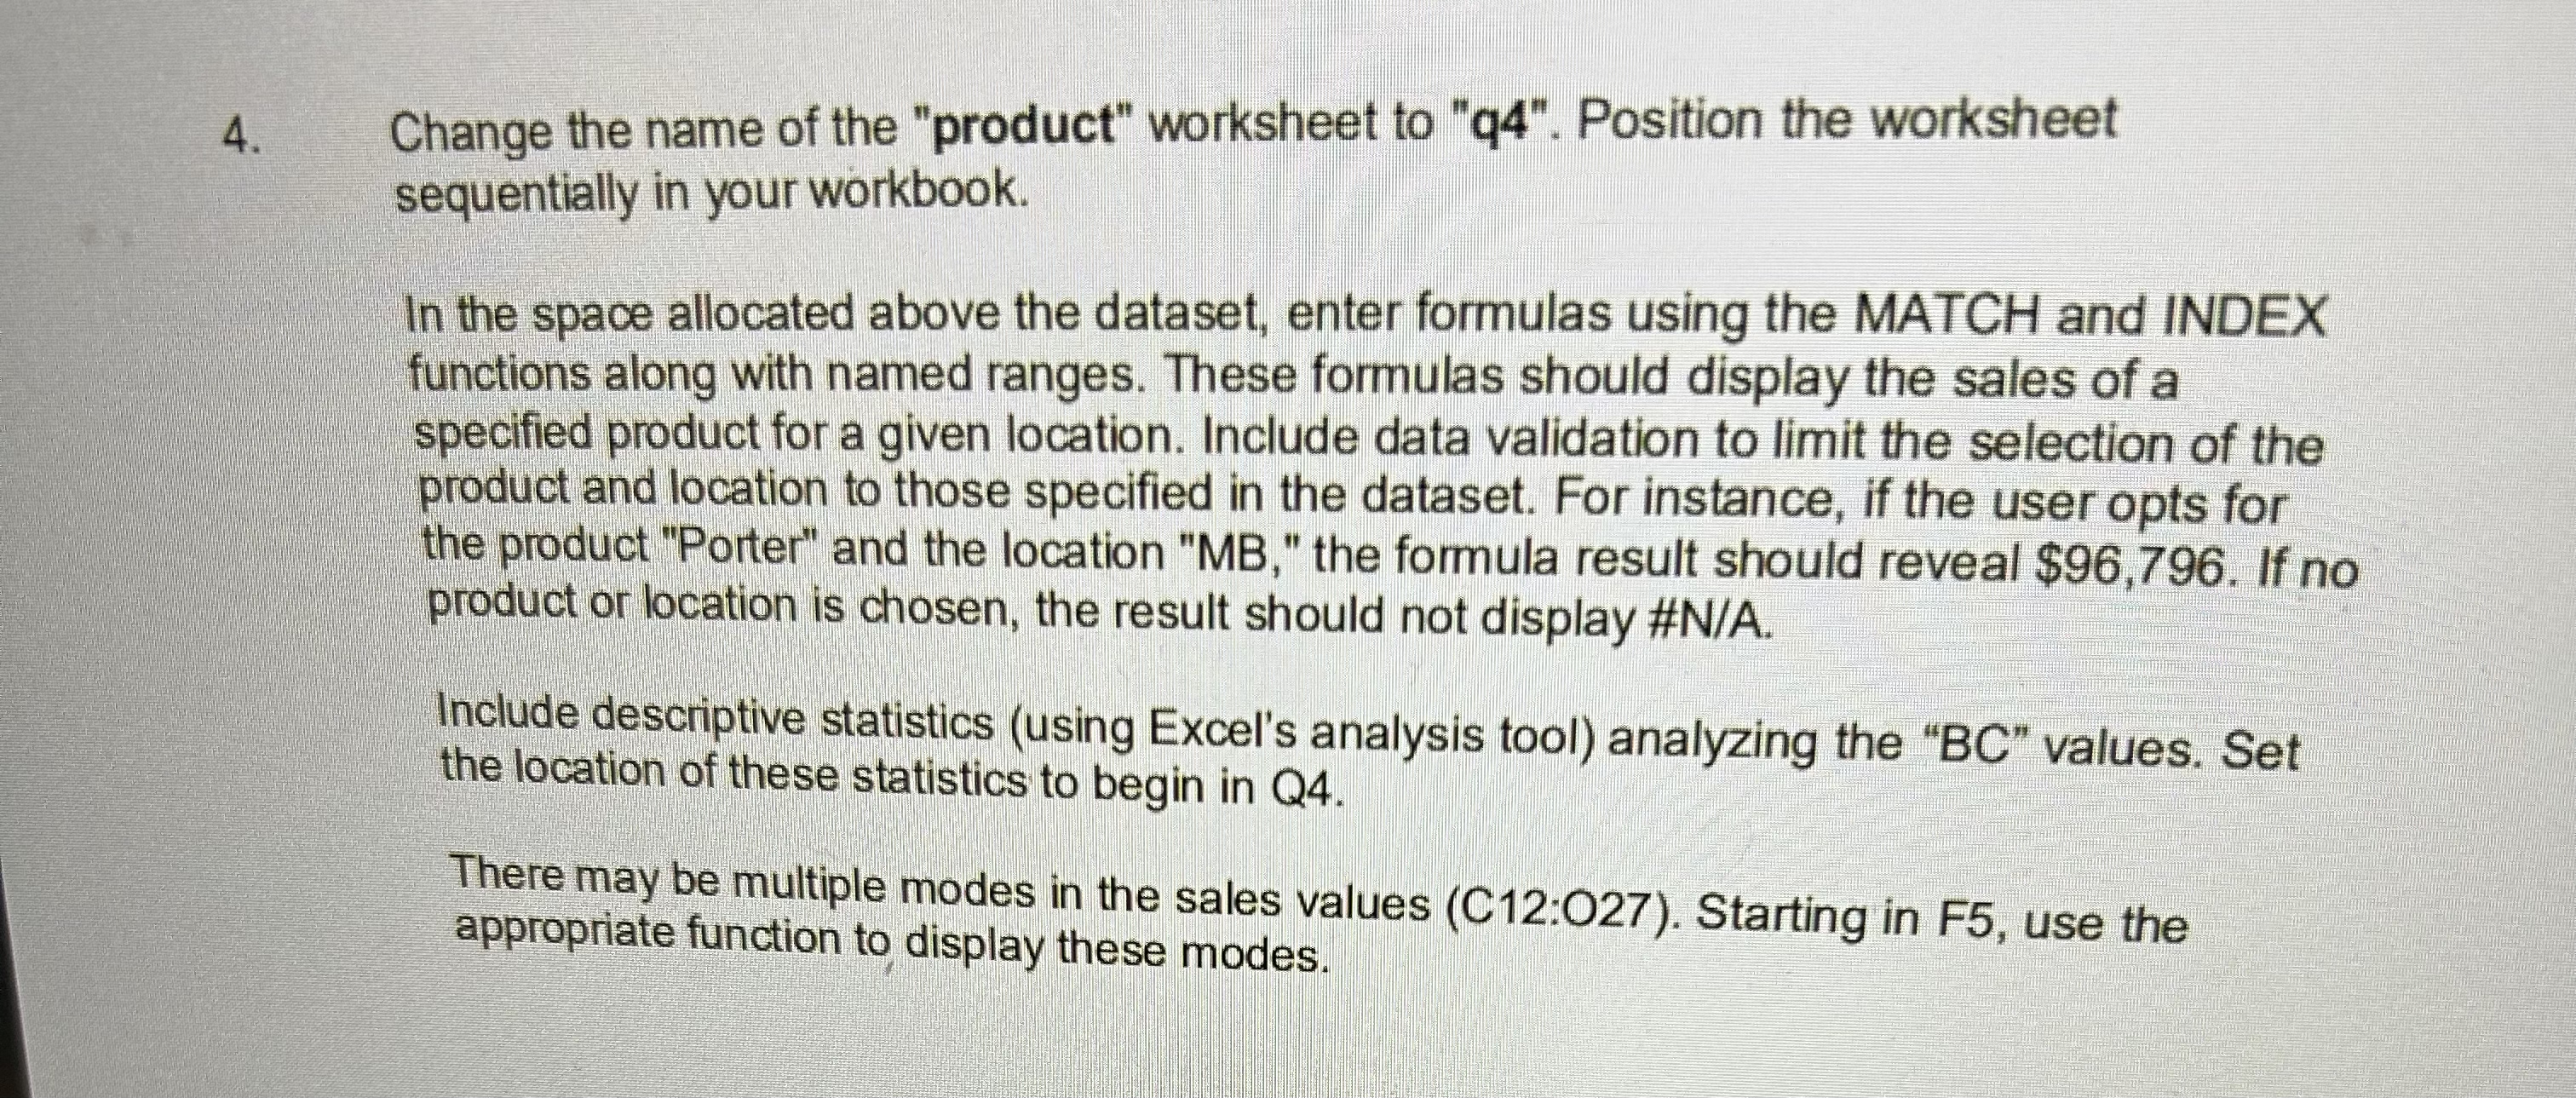
Change the name of the "product" worksheet to q Position the worksheet sequentially in your workbook.
In the space allocated above the dataset, enter formulas using the MATCH and INDEX functions along with named ranges. These formulas should display the sales of a specified product for a given location. Include data validation to limit the selection of the product and location to those specified in the dataset. For instance, if the user opts for the product "Porter" and the location MB the formula result should reveal $ If no product or location is chosen, the result should not display #NA
Include descriptive statistics using Excel's analysis tool analyzing the BC values. Set the location of these statistics to begin in Q
There may be multiple modes in the sales values C:O Starting in use the appropriate function to display these modes.
Step by Step Solution
There are 3 Steps involved in it
Step: 1

Get Instant Access to Expert-Tailored Solutions
See step-by-step solutions with expert insights and AI powered tools for academic success
Step: 2

Step: 3
Ace Your Homework with AI
Get the answers you need in no time with our AI-driven, step-by-step assistance
Get Started
Spatial Database Systems Design Implementation And Project Management
Authors: Albert K.W. Yeung, G. Brent Hall
1st Edition
1402053932, 978-1402053931