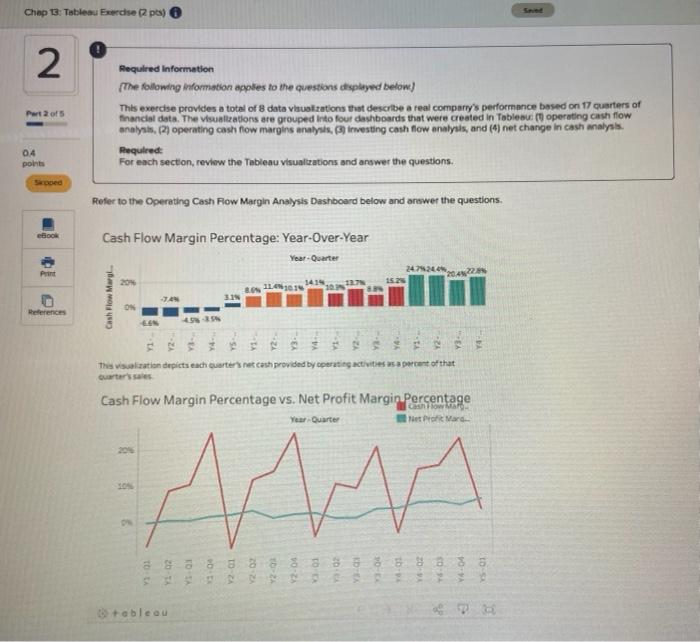
Chap 13: Tableau Bercise (2 pes) 2 Part 2 of 5 Required information The following irformation applies to the questions displayed below) This exercise provides a total of 8 data visualizations that describe a real company's performance based on 17 quarters of financial data. The visualizations are grouped into four dashboards that were created in Tableau ( operating cash flow analysis, (2) operating cash flow margins analysis, (3) investing cash flow analysis, and (4) net change in cash analysis. Required: For each section, review the Tableau visualizations and answer the questions. 04 points Refer to the Operating Cash Flow Margin Analysis Dashboard below and arewer the questions Book Cash Flow Margin Percentage: Year-Over-Year Year-Quarter 24743420422 03031415 Cash Flow Margi -74 ON This sition depicts each quarters net cash provided by operating activities spect of that Cash Flow Margin Percentage vs. Net Profit Margin Percentage wowa Profit Mare Year Quarter SO 333333 33 3 3 tableau Chap 13: Tableau Exercise (2 pts) Required Information 2 2n. Which of the following statements are true with respect to Visualization : Cash Flow Margin Percentage: Year-Over-Year? (You may select more than one answer. Single click the box with the question mark to produce a check mark for a correct answer and double dick the box with the question mark to empty the box for a wrong answer. Any bones left with a question mark will be automatically graded as incorrect.) Part 2 of 5 0.4 points Skinpea 2 deplets each quarter's sales as a percent of that quarter's net cash provided by used in operating activities on a year-over-year base depicts each quarter's net cash provided by (used in operating activities as a percent of that quarter's sales on a year-over-year basis. The four red bars show net cash provided by used in operating activities as a percent of sales for the third quarter of years 14. 25. Which of the following statements are true with respect to Visualization 2. Cash Flow Margin Percentage vs. Net Profit Margin Percentage? (You may select more than one answer. Single click the box with the question mark to produce a check mark for a correct answer and double click the box with the question mark to empty the box for a wrong answer. Any boxes left with a question mark will be automatically graded as incorrect.) eBook Print References It provides a trend analysis of the quarterly cash flow morgin percentage and the net profit margin percentage beginning with the first quarter of year and running consecutively through the first quarter of year 5 It provides a trend analysis of the quarterly cash flow margin percentage and the net profit margin percentage beginning with the first quarter of years 1-5 and running consecutively through the fourth quarter of years 14 depicts net cash provided by operating activities and net income, each stated as a percent of sales. 2c. Which of the following statements are true with respect to Visualization 1 Cash Flow Margin Percentage: Year-Over-Year? (You may select more than one answer. Single click the box with the question mark to produce a check mark for a correct answer and double click the box with the question mark to empty the box for a wrong answer. Any boxes left with a question mark will be automatically graded as incorrect.) The net cash provided by operating activities as a percent of sales shows improvement in the first quarter of year 5 compared to prior first quarters 2 The net cash provided by operating activities as a percent of sales within year took a downturn in quarters 2.3 and 4 compared to the corresponding quarter in the prior year 2 The company's net cash provided by operating activities as a percent of sales is always much greater in the second quarter of every year than in the other three quarters 2d. Which of the following statements are true with respect to Visualization 2: Cash Flow Margin Percentage vs. Net Profit Margin Percentage? [You may select more than one answer. Single click the box with the question mark to produce a check mark for a correct answer and double click the box with the question mark to empty the box for a wrong answer. Any boxes left with a question mark will be automatically graded as incorrect.) The cash flow margin percentage shows huge peaks every thies Quarter followed by big valeys in every subsequent fourth quartet. | The quarterly trend line for the net profit margin percentage is much smoother than the trend line for the cash flow margin percentage The company's net profit margin percentage does not exceed 10% in any quarter 2e. Which of the following statements are true when comparing Visualizations 1 and 2? (You may select more than one answer. Single click the box with the question mark to produce a check mark for a correct answer and double click the box with the question mark to empty the box for a wrong answer. Any boxes left with a question mark will be automatically graded as incorrect.) The bar chart focuses solely on the net profit margin percentage whereas the graph beneath t provides additional insights by comparing the cash flow margin percentage to the net groft margin percentage The bar chart focuses soiely on the cash flow margin percentage whereas the graph beneath it provides additional insights by comparing the cash flow margin percentage to the net profit margin percentage 3 The cash flow margin percentage exceeds 20% in every fourth quarter whereas the net proftmargin percentage never exceeds 10% in every quarter of year 4