

Question
Chapter 10 Mini-Case Bank Performance Analysis Can someone check my work? case: CONCEPTS IN THIS CASE: balance sheet liquidity management asset management liability management return
Chapter 10 Mini-Case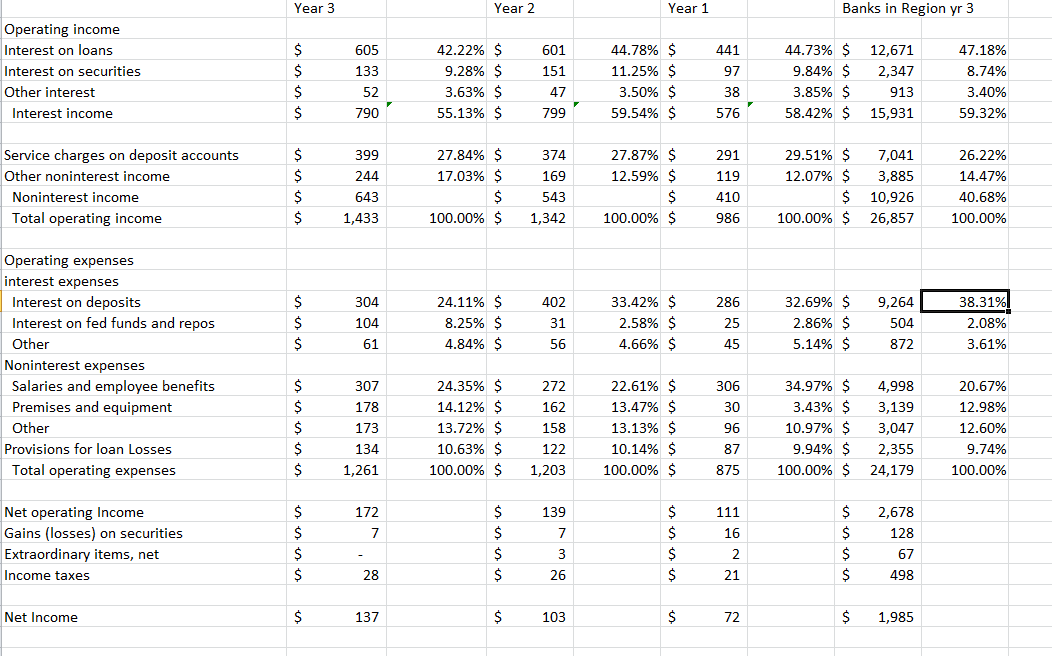
Bank Performance Analysis
Can someone check my work?
case:
CONCEPTS IN THIS CASE:
balance sheet liquidity management asset management liability management return on assets (ROA) return on equity (ROE) operating income operating expenses net interest margin (NIM)
Your supervisor has recently promoted you to a financial analyst position in the bank. The chief financial officer (your supervisor's boss) is concerned about the bank's financial position in comparison with past trends and recent positions of similar banks in the region. To analyze the firm, you have been assigned the task of producing a bank performance analysis. You have done this type of report in your money and banking and finance classes, and you know that the first step is to collect financial data on your bank and similar banks in order to make the necessary comparisons and suggestions for performance improvements. You collect the data in Table 1 and Table 2 from internal annual reports and government publications.
Using balance sheet and income statement data, create a bank analysis and performance report for your supervisor that addresses the following issues:
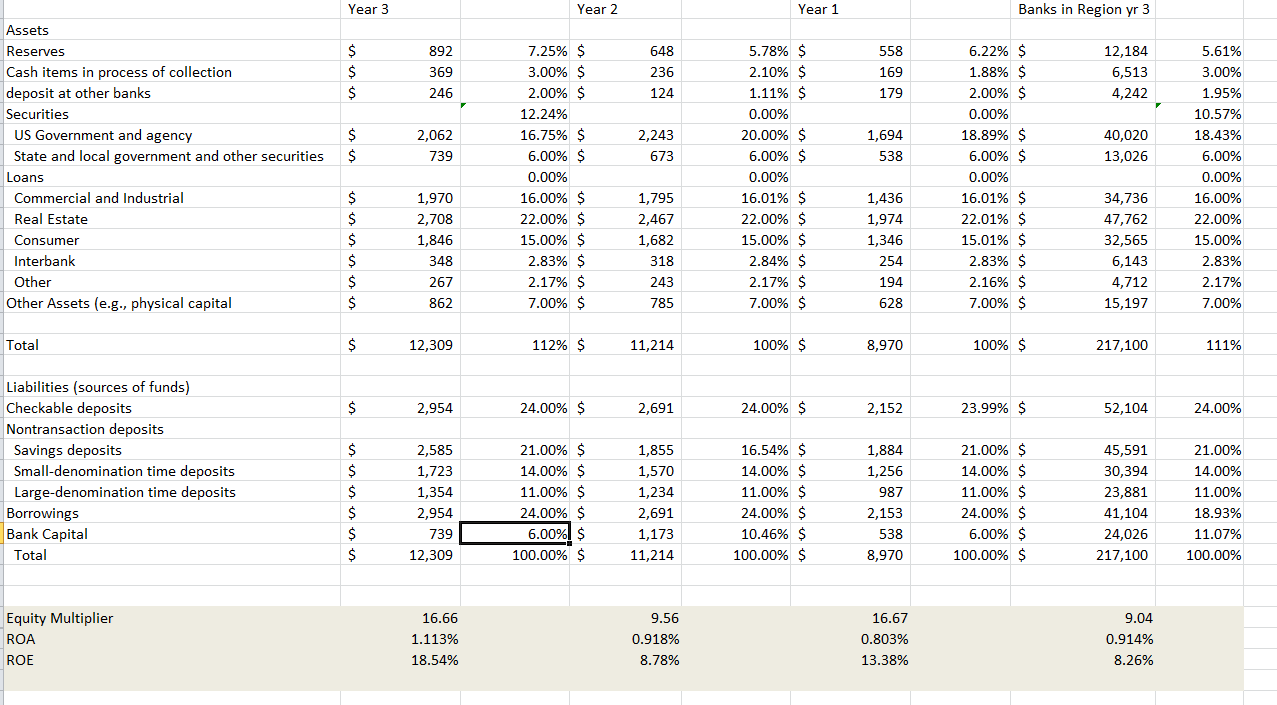
1. Using the balance sheet for each year,
a. Create a balance sheet showing all assets as a percentage of total assets and all liabilities as a percentage of total liabilities. Which assets on your bank's balance sheet increased over the last three years? Which assets on your bank's balance sheet declined over the last three years?
b. Examine the liquidity management practices of your bank over the last three years. How has the liquidity position of the bank changed over time? How does the liquidity position of your bank compare to the regional banks in year 3? Would your bank have sufficient reserves if deposits increased 40% in year 3? (Assume that the reserve requirement is 8% on all deposits.)
c. Calculate the equity multiplier ratio for each year. How has the equity multiplier of your bank changed over time? How does the equity multiplier of your bank compare to the regional banks in year 3?
2. Using the income statement for each year,
a. Create an income statement with operating income items expressed as a percentage of total operating income. Which items improved over the last three years? Which trends need to be reversed? How does your bank compare to the regional banks?
b. Create an income statement with operating expenses expressed as a percentage of total operating expenses. Which items improved over the last three years? Which trends need to be reversed? How does your bank compare to the regional banks?
3. Analyze the performance of the bank for each year.
a. Calculate the return on assets (ROA) for each year. How has the ROA trend changed over the last three years? How does your bank compare to the regional banks?
b. Calculate the return on equity (ROE) for each year. How has the ROE trend changed over the last three years? How does your bank compare to the regional banks?
My answers to the case questions
a.Which assets on your bank's balance sheet increased over the last three years?
Reserves, cash items in process of collections, and deposits at other banks
Which assets on your bank's balance sheet declined over the last three years?
US Government and agency securities
b. How has the liquidity position of the bank changed over time?
Liquidity has improved
How does the liquidity position of your bank compare to the regional banks in year 3?
Liquidity is slightly better than regional banks
Would your bank have sufficient reserves if deposits increased 40% in year 3?
Yes
c. How has the equity multiplier of your bank changed over time? In year 3, increased and it returned to the same level as year one. That means leverage increased compared to year 2.
How does the equity multiplier of your bank compare to the regional banks in year 3?
The bank is more highly leveraged than the regional banks in year 3.
2. a. Which items improved over the last three years?
Non-interest income went up
Which trends need to be reversed?
Service fee income and overall interest earned decreased slightly.
How does your bank compare to the regional banks?
Overall interest is lower and some expense items, like salaries are higher.
b. Which items improved over the last three years?
Interest paid on deposits went down
Which trends need to be reversed?
Interest on fed funds and repos went up and salaries increased slightly
How does your bank compare to the regional banks?
The bank has higher salary expenses than the regional banks
3. How has the ROA trend changed over the last three years?
ROA has improved
How does your bank compare to the regional banks?
It is slightly better than the regional banks
b. How has the ROE trend changed over the last three years?
The ROE has substantially improved
How does your bank compare to the regional banks?
It is much higher than regional banks
4. Identify the strengths and weaknesses of your bank relative to trends over time and in year 3 for all regional banks.
The strengths are the ROA and ROE.
The weaknesses are lower income and some expenses are higher.
What is the relationship between your bank's trends and the year 3 comparison with the region?
Assets are in line with regional banks. Even though income is lower and expenses are higher it is not by a large margin.
Year 3 Year Year 1 Banks in Region yr3 7.25% $ 558 169 6.22% $ 1.88% $ 12,184 6,513 Reserves Cash items in process of collection deposit at other banks Securities 892 10.57% 18.43% 6.00% 0.00% 16.00% 22.00% 15.00% 12.24% 0.00% 0.00% $ 16.75% $ 6.00% $ 0.00% 16.00% $ 22.00% $ US Government and agency State and local government and other securities$ 2,062 739 18.89% $ 40,020 13,026 20.00% 1,694 673 0.00% 16.01% 22.00% 15.00% 2.84% 0.00% 16.01% 22.01% 15.01% Loans Commercial and Industrial Real Estate Consumer Interbank $ $ $ $ $ $ $ 34,736 47,762 32,565 1,970 2,467 1,974 1,846 194 628 2.17% Other Assets (e.g., physical capital 862 7.00% $ 785 7.00% $ 7.00% $ 15,197 12,309 112% $ 11,214 100% $ 8,970 100% $ 217,100 111% Liabilities (sources of funds) Checkable deposits Nontransaction deposits 2,954 2,152 23.99% $ 52,104 Savings deposits Small-denomination time deposits Large-denomination time deposits 2,585 1,723 21.00% $ 14.00% $ 11.00% $ 1,855 1,570 1,234 16.54% $ 14.00% $ 21.00% $ 14.00% $ 11.00% $ 45,591 30,394 23,881 1,256 987 2,153 538 8,970 14.00% 11.00% 18.93% 11.07% 100.00% Borrowings Bank Capital 6.00% $ 100.00% $ 739 6.00%) $ 100.00% $ 10.46% $ 100.00% $ 24,026 217,100 11,214 Equity Multiplier ROA ROE 1.113% 18.54% 0.918% 8.78% 16.67 0.803% 13.38% 0.914% 8.26%Step by Step Solution
There are 3 Steps involved in it
Step: 1

Get Instant Access to Expert-Tailored Solutions
See step-by-step solutions with expert insights and AI powered tools for academic success
Step: 2

Step: 3
Ace Your Homework with AI
Get the answers you need in no time with our AI-driven, step-by-step assistance
Get Started
Audits
Authors: Arthur E Cutforth
1st Edition
1017097445, 978-1017097443