

Answered step by step
Verified Expert Solution
Question
1 Approved Answer
chapter 12, problem 11p Step 3 of 3 A c) NPV profile of project C and D can be shown in the form of a
chapter 12, problem 11p
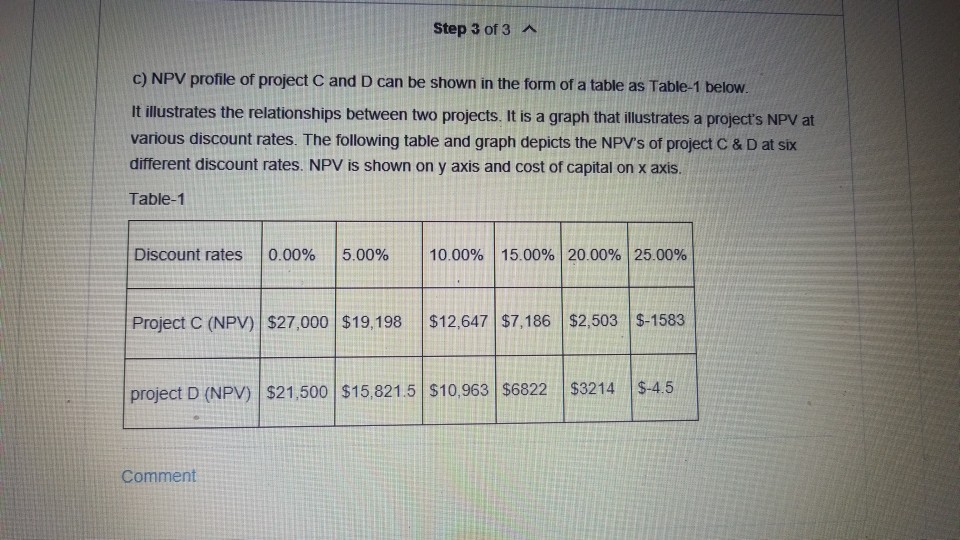
Step 3 of 3 A c) NPV profile of project C and D can be shown in the form of a table as Table-1 below. It illustrates the relationships between two projects. It is a graph that illustrates a project's NPV at various discount rates. The following table and graph depicts the NPV's of project C & D at six different discount rates. NPV is shown on y axis and cost of capital on x axis Table-1 Discount rates | 0.00% | 5.00% | 10.00% | 15.00% | 20.00% 25.00% Project C (NPV) $27,000 $19,198 12,647 $7,186 $2,503 $-1583 project D (NPV) $21,500 $15821.5 $10,963 $6822 $3214 $-45 Comment
Step by Step Solution
There are 3 Steps involved in it
Step: 1

Get Instant Access to Expert-Tailored Solutions
See step-by-step solutions with expert insights and AI powered tools for academic success
Step: 2

Step: 3
Ace Your Homework with AI
Get the answers you need in no time with our AI-driven, step-by-step assistance
Get Started
Social Responsibility Audit A Management Tool For Survival
Authors: John W Humble
1st Edition
0900853522, 978-0900853524