Answered step by step
Verified Expert Solution
Link Copied!

Question

1 Approved Answer

Chapter 12 Q3 See attachment c) Find the sample variances for each neighborhood. 2 S S NON (Type integers or decimals.) d) Find the sample

Chapter 12 Q3 See attachment
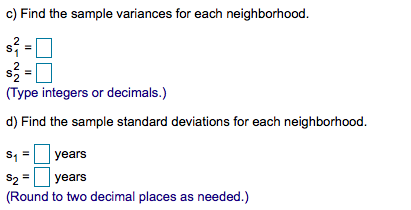
image text in transcribedimage text in transcribedimage text in transcribedimage text in transcribed
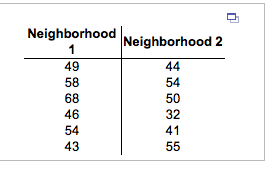
c) Find the sample variances for each neighborhood. 2 S S NON (Type integers or decimals.) d) Find the sample standard deviations for each neighborhood. S4 years S2 years (Round to two decimal places as needed.)e) Find the standard error of the difference of the two sample means. SE (y1 - y2) years (Round to two decimal places as needed.)\fA developer wants to know if the houses in two different neighborhoods were built at roughly the same time. She takes a random sample of six houses from each neighborhood and finds their ages from local records. The accompanying table shows the data for each sample (in years). Complete parts a through e below. Click the icon to view the data table. a) Find the sample means for each neighborhood. y1 years y2 = years (Type integers or decimals.) b) Find the estimated difference of the mean ages of the two neighborhoods, y, - y2. The estimated difference is | years. (Type an integer or a decimal.)

Step by Step Solution

There are 3 Steps involved in it

Step: 1

blur-text-image

Get Instant Access to Expert-Tailored Solutions

See step-by-step solutions with expert insights and AI powered tools for academic success

Step: 2

blur-text-image_2

Step: 3

blur-text-image_3

Ace Your Homework with AI

Get the answers you need in no time with our AI-driven, step-by-step assistance

Get Started

Recommended Textbook for

College Algebra Graphs and Models

Authors: Marvin L. Bittinger, Judith A. Beecher, David J. Ellenbogen, Judith A. Penna

5th edition

321845404, 978-0321791009, 321791002, 978-0321783950, 321783956, 978-0321845405

More Books

Students also viewed these Mathematics questions