Answered step by step
Verified Expert Solution
Link Copied!

Question

1 Approved Answer

Chapter 12, Q35 Can you explain what cells in excel to use to put in these formulas (see below screenshot), if the data is as

Chapter 12, Q35

Can you explain what cells in excel to use to put in these formulas (see below screenshot), if the data is as following screenshot:
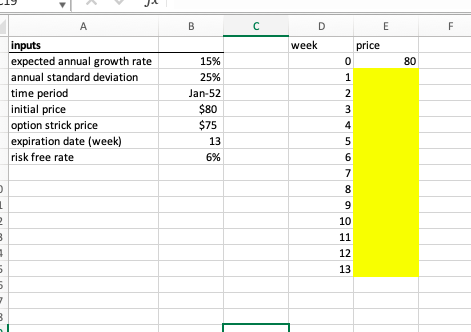
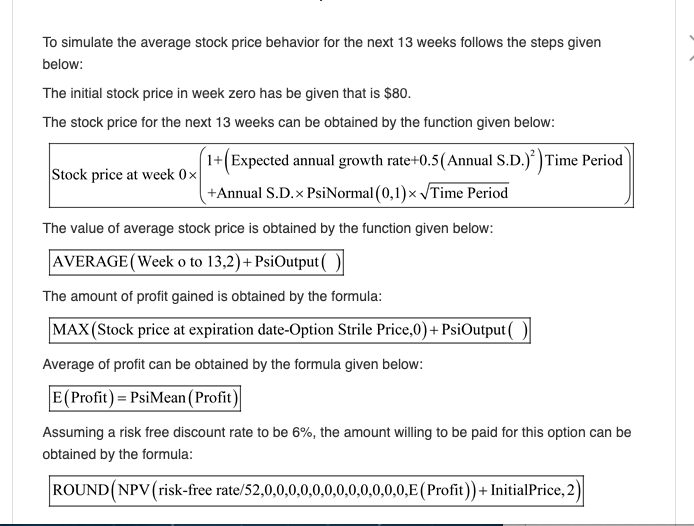
image text in transcribed

image text in transcribed

week price 80 inputs expected annual growth rate annual standard deviation time period initial price option strick price expiration date (week) risk free rate 15% 25% Jan-52 $80 $75 13 6% To simulate the average stock price behavior for the next 13 weeks follows the steps given below: The initial stock price in week zero has be given that is $80. The stock price for the next 13 weeks can be obtained by the function given below: (1+Expected annual growth rate+0.5(Annual S.D.) Time Period Stock price at week 0x +Annual S.D.x PsiNormal(0,1) Time Period The value of average stock price is obtained by the function given below: AVERAGE(Week 0 to 13,2)+ PsiOutput The amount of profit gained is obtained by the formula: MAX(Stock price at expiration date-Option Strile Price,0) + PsiOutput Average of profit can be obtained by the formula given below: E (Profit) = PsiMean(Profit) Assuming a risk free discount rate to be 6%, the amount willing to be paid for this option can be obtained by the formula: ROUND(NPV (risk-free rate/52,0,0,0,0,0,0,0,0,0,0,0,0,E (Profit))+ InitialPrice, 2) week price 80 inputs expected annual growth rate annual standard deviation time period initial price option strick price expiration date (week) risk free rate 15% 25% Jan-52 $80 $75 13 6% To simulate the average stock price behavior for the next 13 weeks follows the steps given below: The initial stock price in week zero has be given that is $80. The stock price for the next 13 weeks can be obtained by the function given below: (1+Expected annual growth rate+0.5(Annual S.D.) Time Period Stock price at week 0x +Annual S.D.x PsiNormal(0,1) Time Period The value of average stock price is obtained by the function given below: AVERAGE(Week 0 to 13,2)+ PsiOutput The amount of profit gained is obtained by the formula: MAX(Stock price at expiration date-Option Strile Price,0) + PsiOutput Average of profit can be obtained by the formula given below: E (Profit) = PsiMean(Profit) Assuming a risk free discount rate to be 6%, the amount willing to be paid for this option can be obtained by the formula: ROUND(NPV (risk-free rate/52,0,0,0,0,0,0,0,0,0,0,0,0,E (Profit))+ InitialPrice, 2)

Step by Step Solution

There are 3 Steps involved in it

Step: 1

blur-text-image

Get Instant Access to Expert-Tailored Solutions

See step-by-step solutions with expert insights and AI powered tools for academic success

Step: 2

blur-text-image

Step: 3

blur-text-image

Ace Your Homework with AI

Get the answers you need in no time with our AI-driven, step-by-step assistance

Get Started

Recommended Textbook for

Fundamentals of Multinational Finance

Authors: Michael H. Moffett, Arthur I. Stonehill, David K. Eiteman

5th edition

205989756, 978-0205989751

More Books

Students also viewed these Finance questions