Question
Chapter 13: Corporations: Organization, Stock Transactions, and Dividends Company: Activision Blizzard Using the annual report of the corporation that you have been researching these weeks,
Chapter 13: Corporations: Organization, Stock Transactions, and Dividends
Company: Activision Blizzard
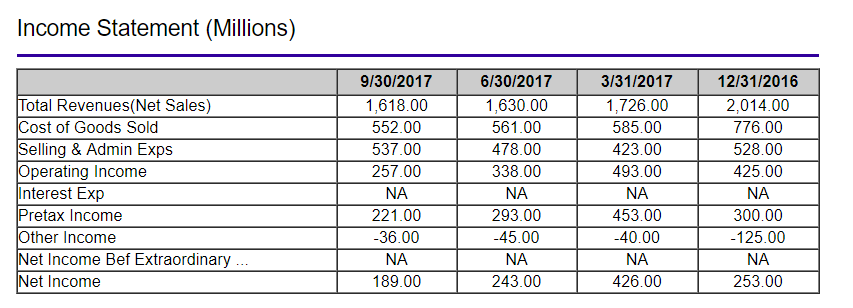
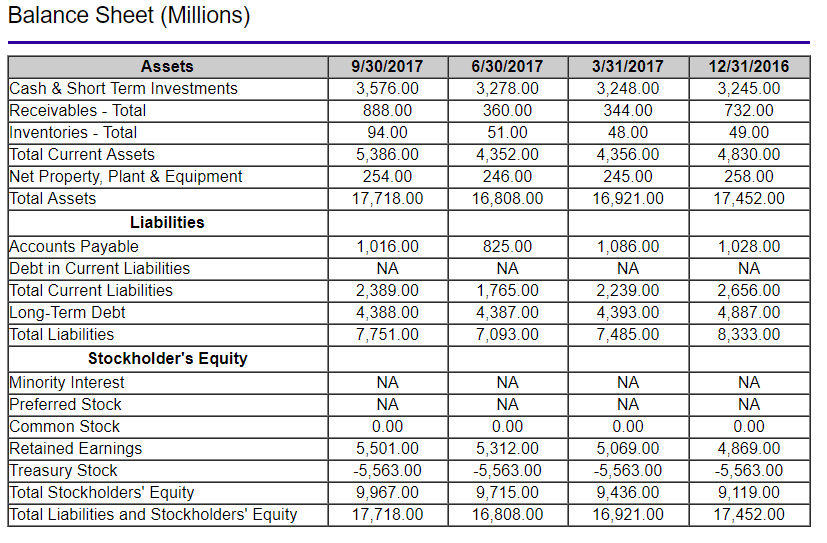
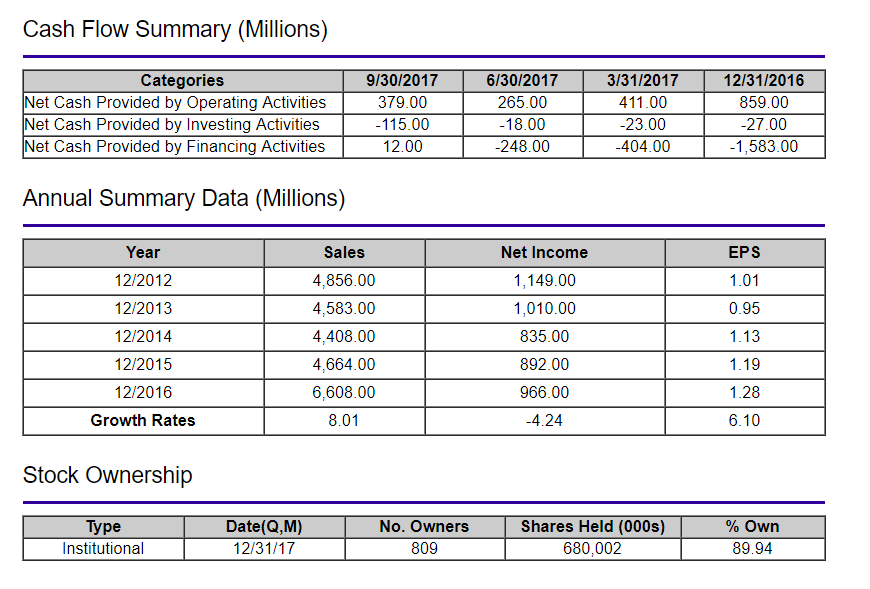
Using the annual report of the corporation that you have been researching these weeks, take a look at that corporation's Statement of Stockholders' Equity. Tell us about the common stock that it issued including its outstanding shares. Also, take a look at a website, such as Yahoo Finance and find information about the corporation's price per share and whether or not it issues a dividend. Your corporation could have probably raised a lot of money by issuing long-term debt instead of issuing stock. What are some advantages of issuing common stock instead of issuing long-term debt? What are some disadvantages?
Please remember that references are required for your initial post. This week, please be sure to reference Chapter 13 of your e-text and use APA style. Also include the link to the financial statements. Also, include the link to Yahoo Finance as a reference.
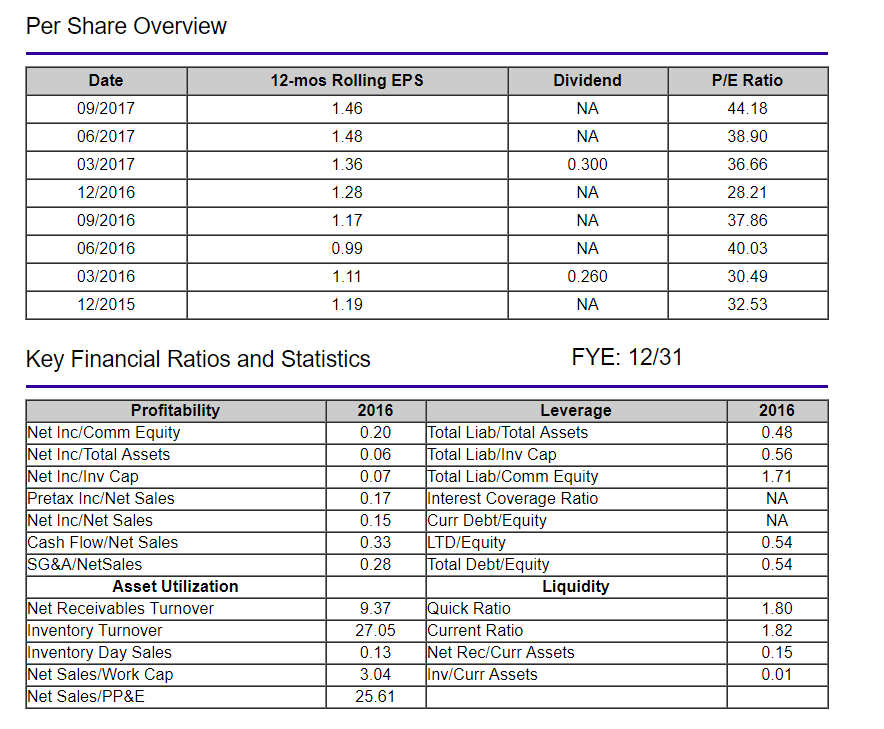
Per Share Overview Date 09/2017 06/2017 03/2017 12/2016 09/2016 06/2016 03/2016 12/2015 12-mos Rolling EPS 1.46 1.48 1.36 1.28 1.17 0.99 1.11 1.19 Dividend NA NA 0.300 NA NA NA 0.260 NA PIE Ratio 44.18 38.90 36.66 28.21 37.86 40.03 30.49 32.53 Key Financial Ratios and Statistics FYE: 12/31 2016 0.20 0.06 0.07 Profitability Leverage 2016 0.48 0.56 1.71 NA NA 0.54 0.54 otal Liab/Total Assets Net Inc/Comm Equity Net Inc/Total Assets Net Inc/lnv Cap Pretax Inc/Net Sales Net Inc/Net Sales Cash Flow/Net Sales SG&A/NetSales otal Liab/lnv Cap Total Liab/Comm Equity Interest Coverage Ratio Curr Debt/Equity 0.15 0.33 LTD/Equity 0.28 Total Debt/Equity Asset Utilization Liquidity Net Receivables Turnover Inventory Turnover Inventory Day Sales Net Sales/Work Cap Net Sales/PP&E 1.80 1.82 0.15 0.01 uick Ratio Current Ratio 9.37 27.05 0.13 Net Rec/Curr Assets 3.04Inv/Curr Assets 25.61 Per Share Overview Date 09/2017 06/2017 03/2017 12/2016 09/2016 06/2016 03/2016 12/2015 12-mos Rolling EPS 1.46 1.48 1.36 1.28 1.17 0.99 1.11 1.19 Dividend NA NA 0.300 NA NA NA 0.260 NA PIE Ratio 44.18 38.90 36.66 28.21 37.86 40.03 30.49 32.53 Key Financial Ratios and Statistics FYE: 12/31 2016 0.20 0.06 0.07 Profitability Leverage 2016 0.48 0.56 1.71 NA NA 0.54 0.54 otal Liab/Total Assets Net Inc/Comm Equity Net Inc/Total Assets Net Inc/lnv Cap Pretax Inc/Net Sales Net Inc/Net Sales Cash Flow/Net Sales SG&A/NetSales otal Liab/lnv Cap Total Liab/Comm Equity Interest Coverage Ratio Curr Debt/Equity 0.15 0.33 LTD/Equity 0.28 Total Debt/Equity Asset Utilization Liquidity Net Receivables Turnover Inventory Turnover Inventory Day Sales Net Sales/Work Cap Net Sales/PP&E 1.80 1.82 0.15 0.01 uick Ratio Current Ratio 9.37 27.05 0.13 Net Rec/Curr Assets 3.04Inv/Curr Assets 25.61Step by Step Solution
There are 3 Steps involved in it
Step: 1
Get Instant Access to Expert-Tailored Solutions
See step-by-step solutions with expert insights and AI powered tools for academic success
Step: 2
Step: 3
Ace Your Homework with AI
Get the answers you need in no time with our AI-driven, step-by-step assistance
Get Started