

Answered step by step
Verified Expert Solution
Question
1 Approved Answer
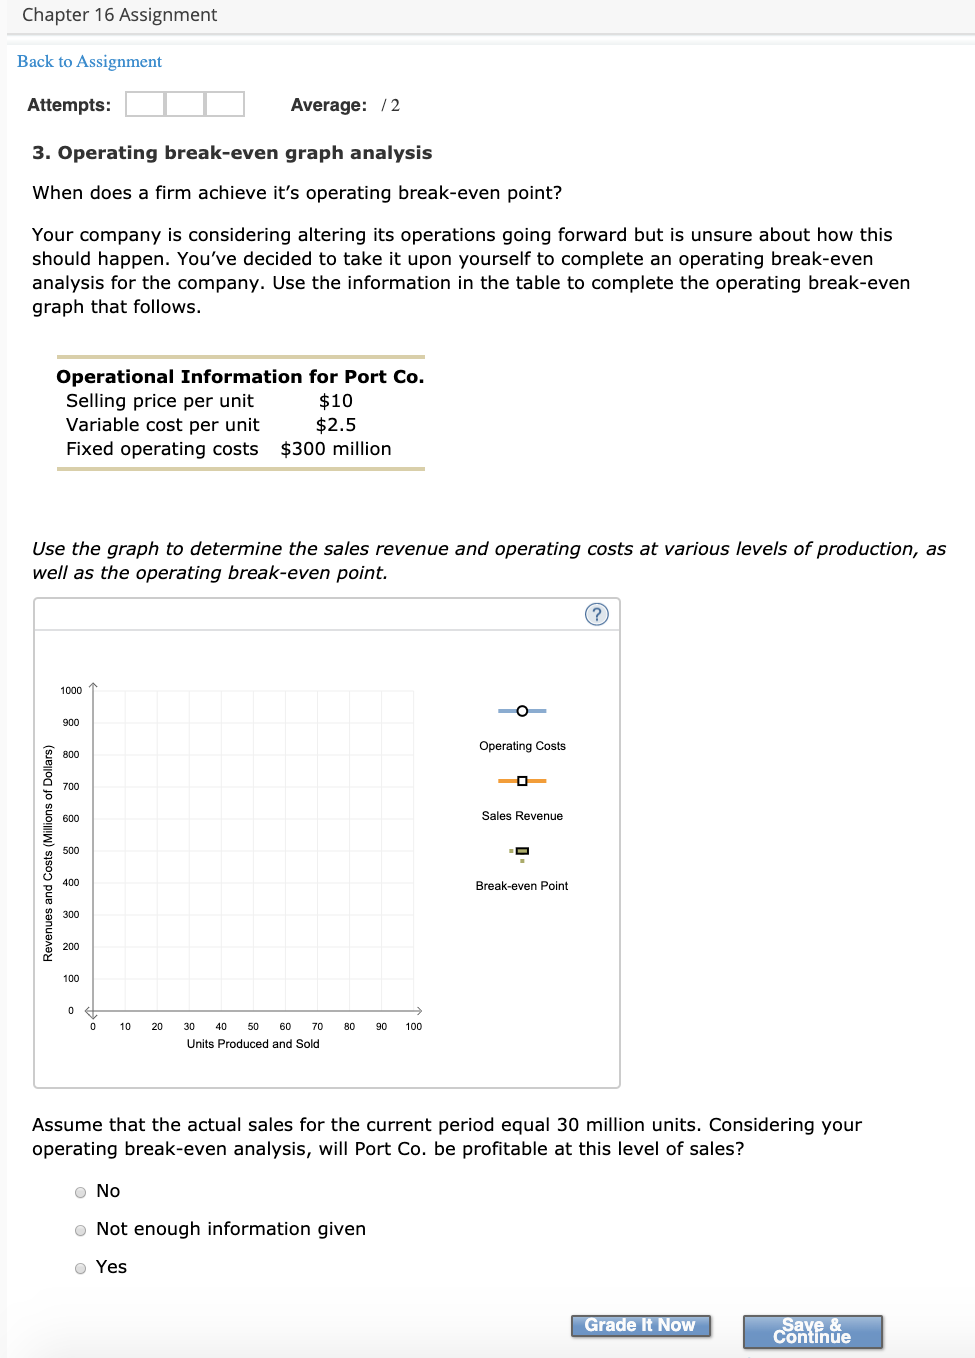
Chapter 16 Assignment Back to Assignment Attempts: Average: /2 3. Operating break-even graph analysis When does a firm achieve it's operating break-even point? Your company
Step by Step Solution
There are 3 Steps involved in it
Step: 1

Get Instant Access to Expert-Tailored Solutions
See step-by-step solutions with expert insights and AI powered tools for academic success
Step: 2

Step: 3
Ace Your Homework with AI
Get the answers you need in no time with our AI-driven, step-by-step assistance
Get Started
Companies Audit Investigations And Community Enterprise Act 2004 UK
Authors: The Law Library
1st Edition
1987582950, 978-1987582956