

Answered step by step
Verified Expert Solution
Question
1 Approved Answer
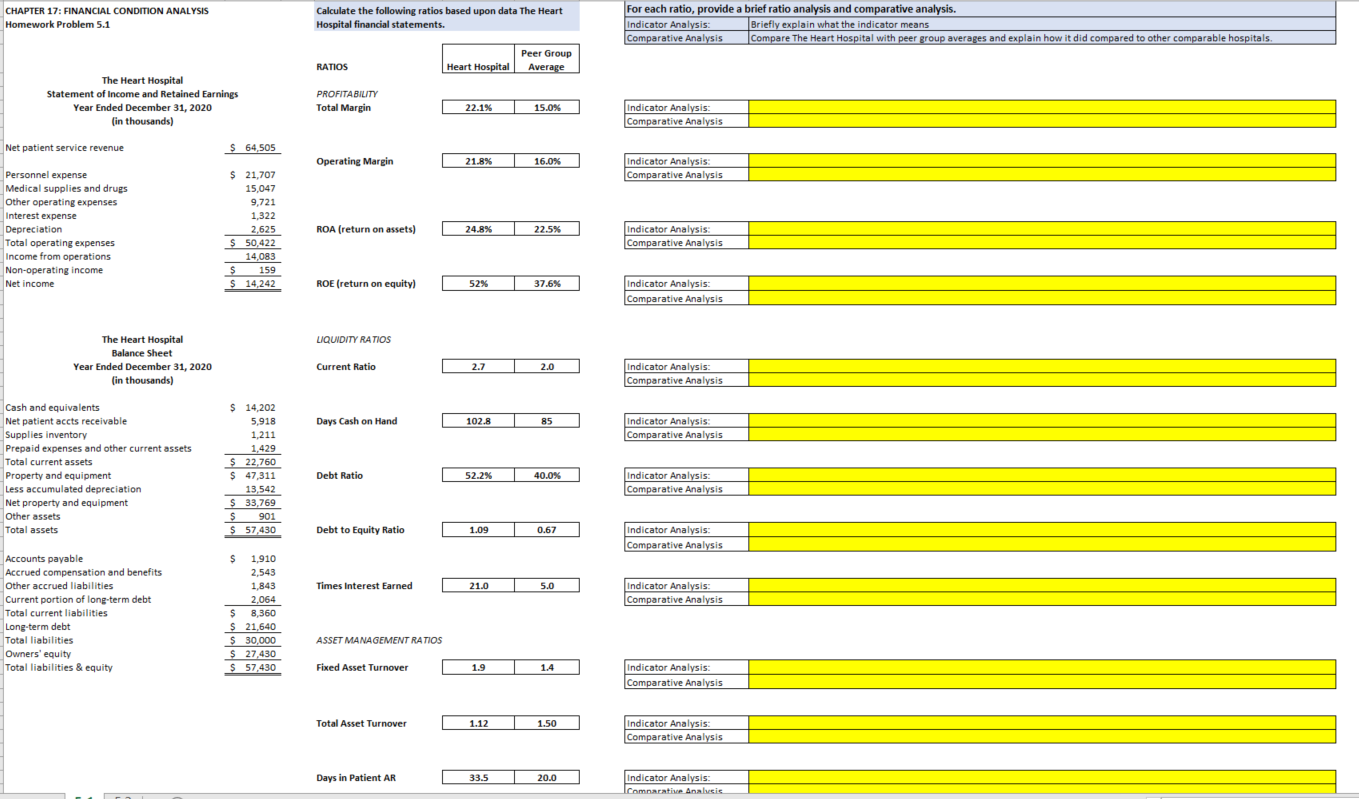
CHAPTER 17: FINANCIAL CONDITION ANALYSIS Homework Problem 5.1 Calculate the following ratios based upon data The Heart Hospital financial statements. For each ratio, provide a
Step by Step Solution
There are 3 Steps involved in it
Step: 1

Get Instant Access to Expert-Tailored Solutions
See step-by-step solutions with expert insights and AI powered tools for academic success
Step: 2

Step: 3
Ace Your Homework with AI
Get the answers you need in no time with our AI-driven, step-by-step assistance
Get Started
Fundamentals of Multinational Finance
Authors: Michael H. Moffett, Arthur I. Stonehill, David K. Eiteman
5th edition
205989756, 978-0205989751