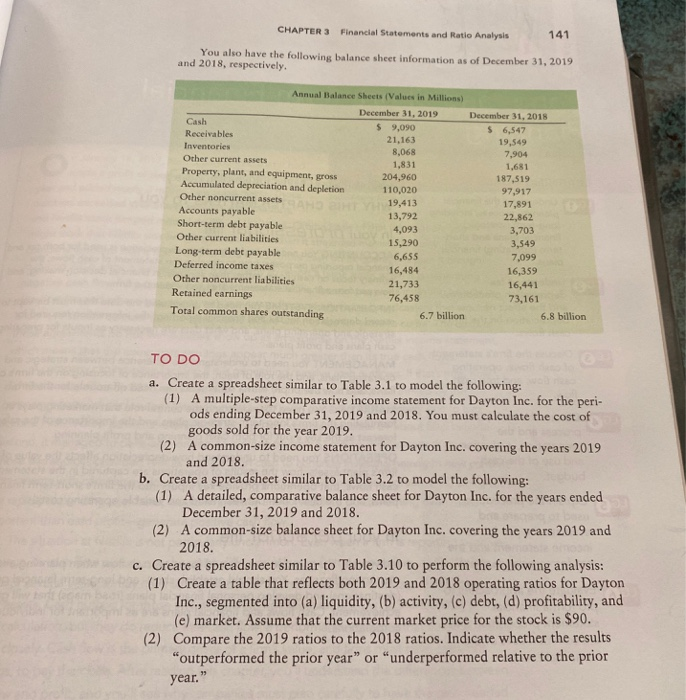
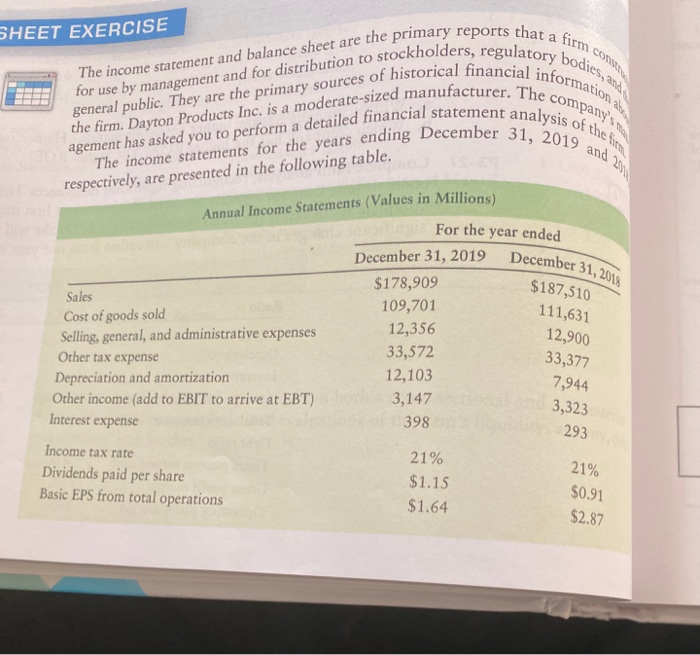
CHAPTER 3 Financial Statements and Ratio Analysis 141 You also have the following balance sheet information as of December 31, 2019 and 2018, respectively. Annual Balance Sheets (Values in Millions) December 31, 2019 December 31, 2018 Cash $ 9,090 $ 6,547 Receivables 21,163 19,549 Inventories 8,068 7,904 Other current assets 1,831 1,681 Property, plant, and equipment, gross 204,960 187,519 Accumulated depreciation and depletion 110,020 97,917 Other noncurrent assets 19,413 17,891 Accounts payable 13,792 22,862 Short-term debt payable 4,093 3,703 Other current liabilities 15,290 3,549 Long-term debt payable 6,655 7,099 Deferred income taxes 16,484 16,359 Other noncurrent liabilities 21,733 16,441 Retained earnings 76,458 73,161 Total common shares outstanding 6.7 billion 6.8 billion TO DO a. Create a spreadsheet similar to Table 3.1 to model the following: (1) A multiple-step comparative income statement for Dayton Inc. for the peri- ods ending December 31, 2019 and 2018. You must calculate the cost of goods sold for the year 2019. (2) A common-size income statement for Dayton Inc. covering the years 2019 and 2018. b. Create a spreadsheet similar to Table 3.2 to model the following: (1) A detailed, comparative balance sheet for Dayton Inc. for the years ended December 31, 2019 and 2018. (2) A common-size balance sheet for Dayton Inc. covering the years 2019 and 2018. c. Create a spreadsheet similar to Table 3.10 to perform the following analysis: (1) Create a table that reflects both 2019 and 2018 operating ratios for Dayton Inc., segmented into (a) liquidity, (b) activity, (c) debt, (d) profitability, and (e) market. Assume that the current market price for the stock is $90. (2) Compare the 2019 ratios to the 2018 ratios. Indicate whether the results "outperformed the prior year or underperformed relative to the prior year." SHEET EXERCISE company's respectively, are presented in the following table, Annual Income Statements (Values in Millions) for use by management and for distribution to stockholders, regulatory bodies, and The income statement and balance sheet are the primary reports that a firm CODE general public. They are the primary sources of historical financial information a agement has asked you to perform a detailed financial statement analysis of the form the firm. Dayton Products Inc. is a moderate-sized manufacturer. The The income statements for the years ending December 31, 2019 and 2 December 31, 2018 For the year ended December 31, 2019 $178,909 Sales 109,701 Cost of goods sold 12,356 Selling, general, and administrative expenses Other tax expense 33,572 Depreciation and amortization 12,103 Other income (add to EBIT to arrive at EBT) 3,147 Interest expense 398 Income tax rate 21% Dividends paid per share $1.15 Basic EPS from total operations $1.64 $187,510 111,631 12,900 33,377 7,944 3,323 293 21% $0.91 $2.87 CHAPTER 3 Financial Statements and Ratio Analysis 141 You also have the following balance sheet information as of December 31, 2019 and 2018, respectively. Annual Balance Sheets (Values in Millions) December 31, 2019 December 31, 2018 Cash $ 9,090 $ 6,547 Receivables 21,163 19,549 Inventories 8,068 7,904 Other current assets 1,831 1,681 Property, plant, and equipment, gross 204,960 187,519 Accumulated depreciation and depletion 110,020 97,917 Other noncurrent assets 19,413 17,891 Accounts payable 13,792 22,862 Short-term debt payable 4,093 3,703 Other current liabilities 15,290 3,549 Long-term debt payable 6,655 7,099 Deferred income taxes 16,484 16,359 Other noncurrent liabilities 21,733 16,441 Retained earnings 76,458 73,161 Total common shares outstanding 6.7 billion 6.8 billion TO DO a. Create a spreadsheet similar to Table 3.1 to model the following: (1) A multiple-step comparative income statement for Dayton Inc. for the peri- ods ending December 31, 2019 and 2018. You must calculate the cost of goods sold for the year 2019. (2) A common-size income statement for Dayton Inc. covering the years 2019 and 2018. b. Create a spreadsheet similar to Table 3.2 to model the following: (1) A detailed, comparative balance sheet for Dayton Inc. for the years ended December 31, 2019 and 2018. (2) A common-size balance sheet for Dayton Inc. covering the years 2019 and 2018. c. Create a spreadsheet similar to Table 3.10 to perform the following analysis: (1) Create a table that reflects both 2019 and 2018 operating ratios for Dayton Inc., segmented into (a) liquidity, (b) activity, (c) debt, (d) profitability, and (e) market. Assume that the current market price for the stock is $90. (2) Compare the 2019 ratios to the 2018 ratios. Indicate whether the results "outperformed the prior year or underperformed relative to the prior year." SHEET EXERCISE company's respectively, are presented in the following table, Annual Income Statements (Values in Millions) for use by management and for distribution to stockholders, regulatory bodies, and The income statement and balance sheet are the primary reports that a firm CODE general public. They are the primary sources of historical financial information a agement has asked you to perform a detailed financial statement analysis of the form the firm. Dayton Products Inc. is a moderate-sized manufacturer. The The income statements for the years ending December 31, 2019 and 2 December 31, 2018 For the year ended December 31, 2019 $178,909 Sales 109,701 Cost of goods sold 12,356 Selling, general, and administrative expenses Other tax expense 33,572 Depreciation and amortization 12,103 Other income (add to EBIT to arrive at EBT) 3,147 Interest expense 398 Income tax rate 21% Dividends paid per share $1.15 Basic EPS from total operations $1.64 $187,510 111,631 12,900 33,377 7,944 3,323 293 21% $0.91 $2.87