Answered step by step
Verified Expert Solution
Question
1 Approved Answer
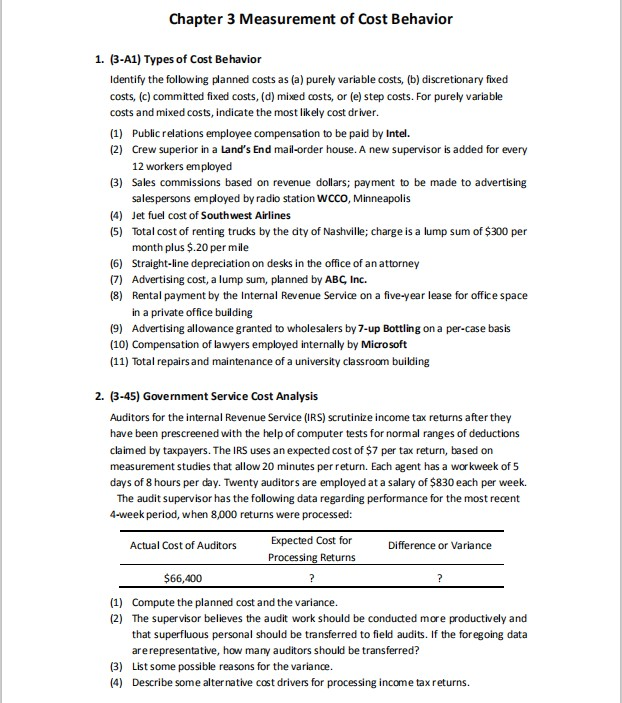
Chapter 3 Measurement of Cost Behavior 1. (3-A1) Types of Cost Behavior Identify the following planned costs as (a) purely variable costs, (b) discretionary fixed


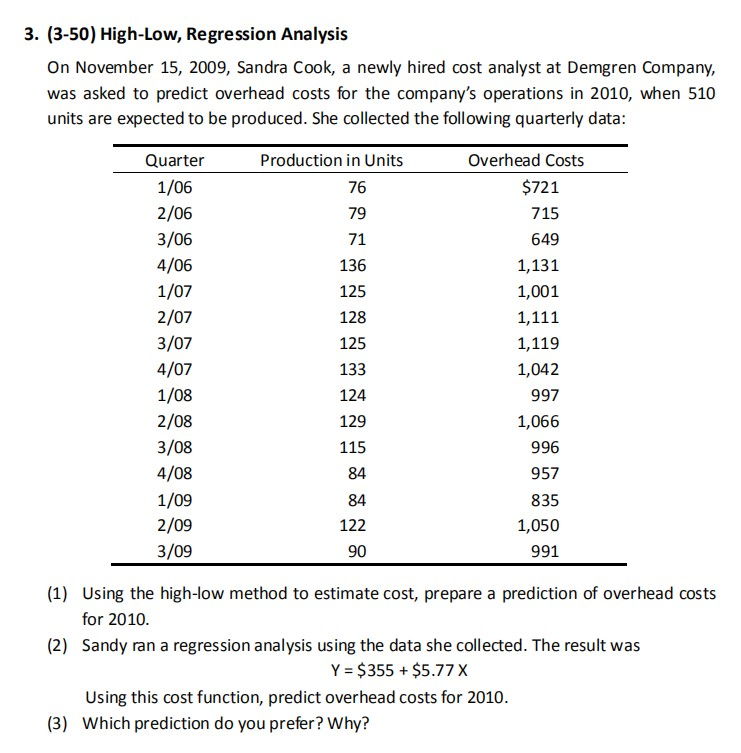
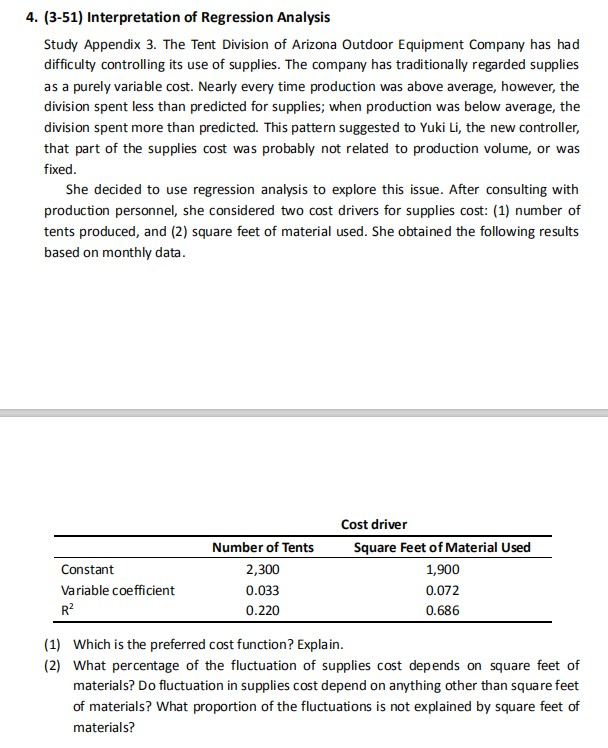
Chapter 3 Measurement of Cost Behavior 1. (3-A1) Types of Cost Behavior Identify the following planned costs as (a) purely variable costs, (b) discretionary fixed costs, (c) committed fixed costs, (d) mixed costs, or (e) step costs. For purely variable costs and mixed costs, indicate the most likely cost driver. (1) Public relations employee compensation to be paid by Intel. (2) Crew superior in a Land's End mail-order house. A new supervisor is added for every 12 workers employed (3) Sales commissions based on revenue dollars; payment to be made to advertising salespersons employed by radio station WCCO, Minneapolis (4) Jet fuel cost of Southwest Airlines (5) Total cost of renting trucks by the city of Nashville; charge is a lump sum of $300 per month plus $.20 per mile (6) Straight-line depreciation on desks in the office of an attorney (7) Advertising cost, a lump sum, planned by ABC, Inc. (8) Rental payment by the Internal Revenue Service on a five-year lease for office space in a private office building (9) Advertising allowance granted to wholesalers by 7-up Bottling on a per-case basis (10) Compensation of lawyers employed internally by Microsoft (11) Total repairs and maintenance of a university classroom building 2. (3-45) Government Service Cost Analysis Auditors for the internal Revenue Service (IRS) scrutinize income tax returns after they have been prescreened with the help of computer tests for normal ranges of deductions claimed by taxpayers. The IRS uses an expected cost of $7 per tax return, based on measurement studies that allow 20 minutes per return. Each agent has a workweek of 5 days of 8 hours per day. Twenty auditors are employed at a salary of $830 each per week. The audit supervisor has the following data regarding performance for the most recent 4-week period, when 8,000 returns were processed: Actual Cost of Auditors Expected Cost for Processing Returns Difference or Variance $66,400 (1) Compute the planned cost and the variance. (2) The supervisor believes the audit work should be conducted more productively and that superfluous personal should be transferred to field audits. If the foregoing data are representative, how many auditors should be transferred? (3) List some possible reasons for the variance. (4) Describe some alternative cost drivers for processing income tax returns. 3. (3-50) High-Low, Regression Analysis On November 15, 2009, Sandra Cook, a newly hired cost analyst at Demgren Company, was asked to predict overhead costs for the company's operations in 2010, when 510 units are expected to be produced. She collected the following quarterly data: Production in Units Overhead Costs $721 79 715 125 Quarter 1/06 2/06 3/06 4/06 1/07 2/07 3/07 4/07 1/08 2/08 3/08 4/08 1/09 2/09 3/09 649 1,131 1,001 1,111 1,119 1,042 997 1,066 996 957 835 1,050 991 122 90 (1) Using the high-low method to estimate cost, prepare a prediction of overhead costs for 2010 (2) Sandy ran a regression analysis using the data she collected. The result was Y = $355 + $5.77 X Using this cost function, predict overhead costs for 2010. (3) Which prediction do you prefer? Why? 4. (3-51) Interpretation of Regression Analysis Study Appendix 3. The Tent Division of Arizona Outdoor Equipment Company has had difficulty controlling its use of supplies. The company has traditionally regarded supplies as a purely variable cost. Nearly every time production was above average, however, the division spent less than predicted for supplies; when production was below average, the division spent more than predicted. This pattern suggested to Yuki Li, the new controller, that part of the supplies cost was probably not related to production volume, or was fixed. She decided to use regression analysis to explore this issue. After consulting with production personnel, she considered two cost drivers for supplies cost: (1) number of tents produced, and (2) square feet of material used. She obtained the following results based on monthly data. Constant Variable coefficient Number of Tents 2,300 0.033 0.220 Cost driver Square Feet of Material Used 1,900 0.072 0.686 (1) Which is the preferred cost function? Explain. (2) What percentage of the fluctuation of supplies cost depends on square feet of materials? Do fluctuation in supplies cost depend on anything other than square feet of materials? What proportion of the fluctuations is not explained by square feet of materials
Step by Step Solution
There are 3 Steps involved in it
Step: 1

Get Instant Access to Expert-Tailored Solutions
See step-by-step solutions with expert insights and AI powered tools for academic success
Step: 2

Step: 3

Ace Your Homework with AI
Get the answers you need in no time with our AI-driven, step-by-step assistance
Get Started


