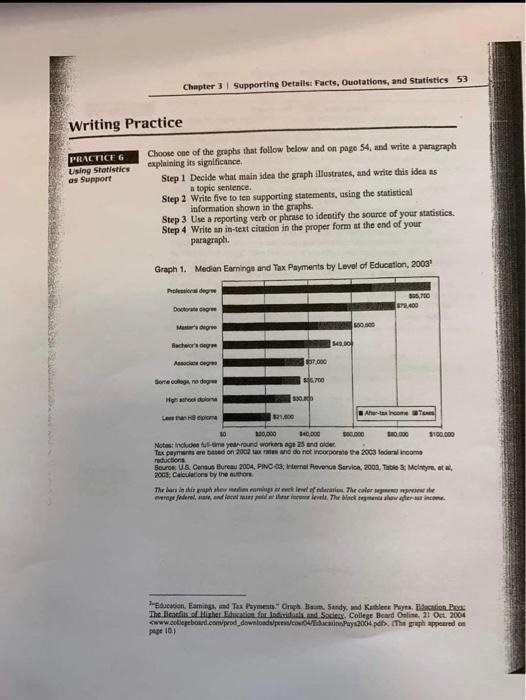
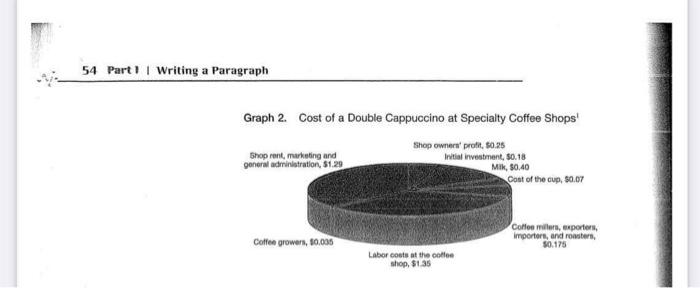
Chapter 3 Supporting Details: Facts, Quotations, and Statistics 53 Choose one of the graphs that follow below and on page 54, and write a paragraph explaining its significance. Step 1 Decide what main idea the graph illustrates, and write this idea as a topic sentence. Step 2 Write five to ten supporting statements, using the statistical information shown in the graphs. Step 3 Use a reporting verb or phrase to identify the source of your statistics. Step 4 Write an in-text citation in the proper form at the end of your paragraph. Graph 1. Median Earnings and Tax Payments by Level of Education, 2003 Professional degre 505,700 $78,400 Doctorate gre $50.500 Master's degre Bachor's degr Associate degree Some collage, no depe High school dolo After-tax income Ta Less than ma 100,000 $40,000 $00.000 $80.000 $100,000 Notes: includes fus-time year-round workers age 25 and older Tax payments are based on 2002 tax rates and do not incorporate the 2003 federal income reductions Source: US Census Bureau 2004, PINC-03; Internal Revenue Service, 2003, Table 3 Monty, ta 2005; Calculations by the authors The bars in this graph show medio amings er eck level of education. The color segments the everage federal, ase, and local e paid tar income levels. The black segments show after-income. 1-Education, Eamings, and Tax Payments Orph Baum, Sendy, and Kathleez Payns. Elacation Po The Beatfin of Higher Education for Individuals and Society. College Board Online, 21 Oct 2004 www.collegeboud.com/prod_downloads/press/co04/dacatinnPays2004 pdf. (The graph appeared on page 10) Writing Practice PRACTICE 6 Using Statistics as Support 37,000 $21,000 $5.700 $30.00 $49.00 54 Part 1 | Writing a Paragraph Graph 2. Cost of a Double Cappuccino at Specialty Coffee Shops Shop owners' profit, $0.25 Shop rent, marketing and general administration, $1.29 Initial investment, $0.18 Mik, $0.40 Cost of the cup, $0.07 Coffee millers, exporters, importers, and roasters, $0.175 Coffee growers, $0.005 Labor costs at the coffee shop, $1.35 Chapter 3 Supporting Details: Facts, Quotations, and Statistics 53 Choose one of the graphs that follow below and on page 54, and write a paragraph explaining its significance. Step 1 Decide what main idea the graph illustrates, and write this idea as a topic sentence. Step 2 Write five to ten supporting statements, using the statistical information shown in the graphs. Step 3 Use a reporting verb or phrase to identify the source of your statistics. Step 4 Write an in-text citation in the proper form at the end of your paragraph. Graph 1. Median Earnings and Tax Payments by Level of Education, 2003 Professional degre 505,700 $78,400 Doctorate gre $50.500 Master's degre Bachor's degr Associate degree Some collage, no depe High school dolo After-tax income Ta Less than ma 100,000 $40,000 $00.000 $80.000 $100,000 Notes: includes fus-time year-round workers age 25 and older Tax payments are based on 2002 tax rates and do not incorporate the 2003 federal income reductions Source: US Census Bureau 2004, PINC-03; Internal Revenue Service, 2003, Table 3 Monty, ta 2005; Calculations by the authors The bars in this graph show medio amings er eck level of education. The color segments the everage federal, ase, and local e paid tar income levels. The black segments show after-income. 1-Education, Eamings, and Tax Payments Orph Baum, Sendy, and Kathleez Payns. Elacation Po The Beatfin of Higher Education for Individuals and Society. College Board Online, 21 Oct 2004 www.collegeboud.com/prod_downloads/press/co04/dacatinnPays2004 pdf. (The graph appeared on page 10) Writing Practice PRACTICE 6 Using Statistics as Support 37,000 $21,000 $5.700 $30.00 $49.00 54 Part 1 | Writing a Paragraph Graph 2. Cost of a Double Cappuccino at Specialty Coffee Shops Shop owners' profit, $0.25 Shop rent, marketing and general administration, $1.29 Initial investment, $0.18 Mik, $0.40 Cost of the cup, $0.07 Coffee millers, exporters, importers, and roasters, $0.175 Coffee growers, $0.005 Labor costs at the coffee shop, $1.35


