

Question: 1. Use these data to answer Questions 1a and 1b. These data are saved as Chapter 5 Data Set 2. 1. Compute the Pearson
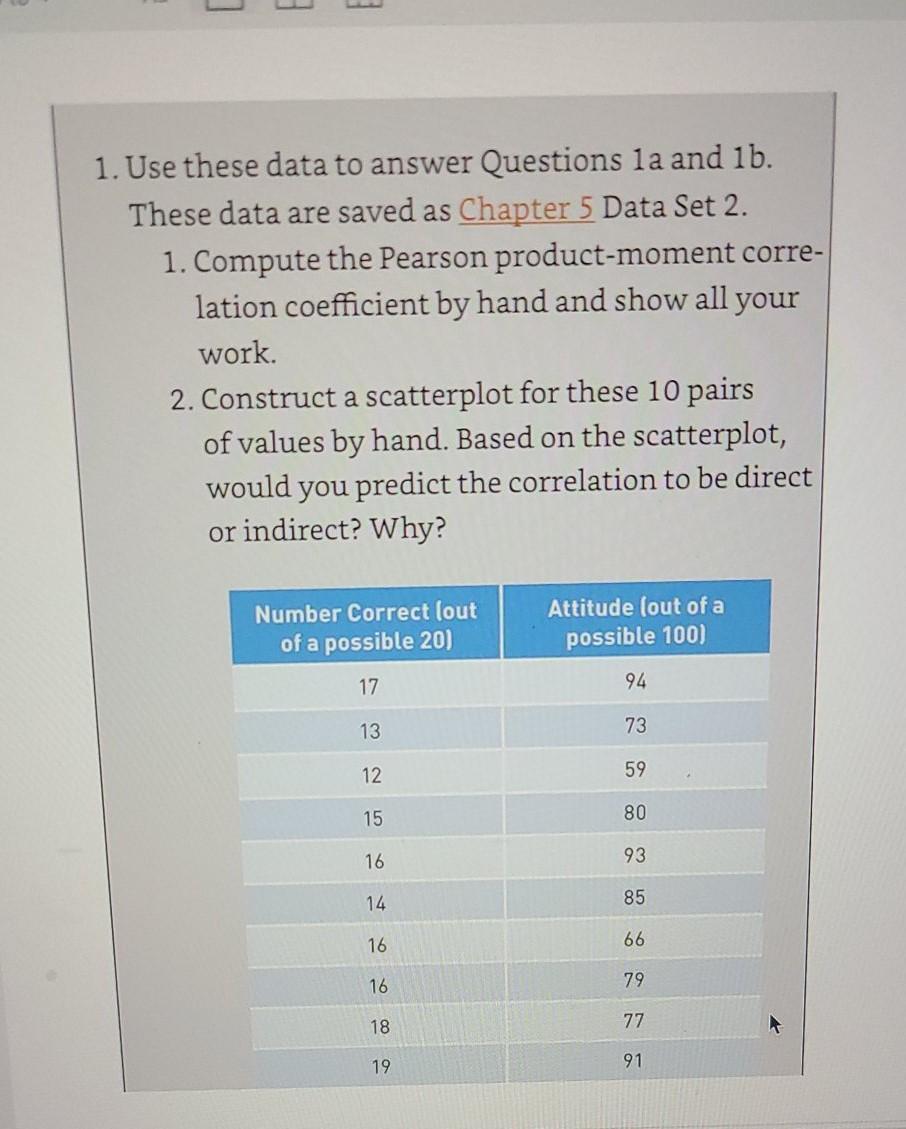
1. Use these data to answer Questions 1a and 1b. These data are saved as Chapter 5 Data Set 2. 1. Compute the Pearson product-moment corre- lation coefficient by hand and show all your work. 2. Construct a scatterplot for these 10 pairs of values by hand. Based on the scatterplot, would you predict the correlation to be direct or indirect? Why? Number Correct (out of a possible 20) 17 13 12 15 16 14 16 16 18 19 Attitude (out of a possible 100) 94 73 59 80 93 85 66 79 77 91
Step by Step Solution
3.46 Rating (149 Votes )
There are 3 Steps involved in it
X x 17 13 12 15 16 14 16 16 18 19 Y 73 59 93 85 66 79 77 Sum... View full answer

Get step-by-step solutions from verified subject matter experts
Document Format (2 attachments)
635e19c6774c3_181463.pdf
180 KBs PDF File
635e19c6774c3_181463.docx
120 KBs Word File