Chapter 7 Build a Model
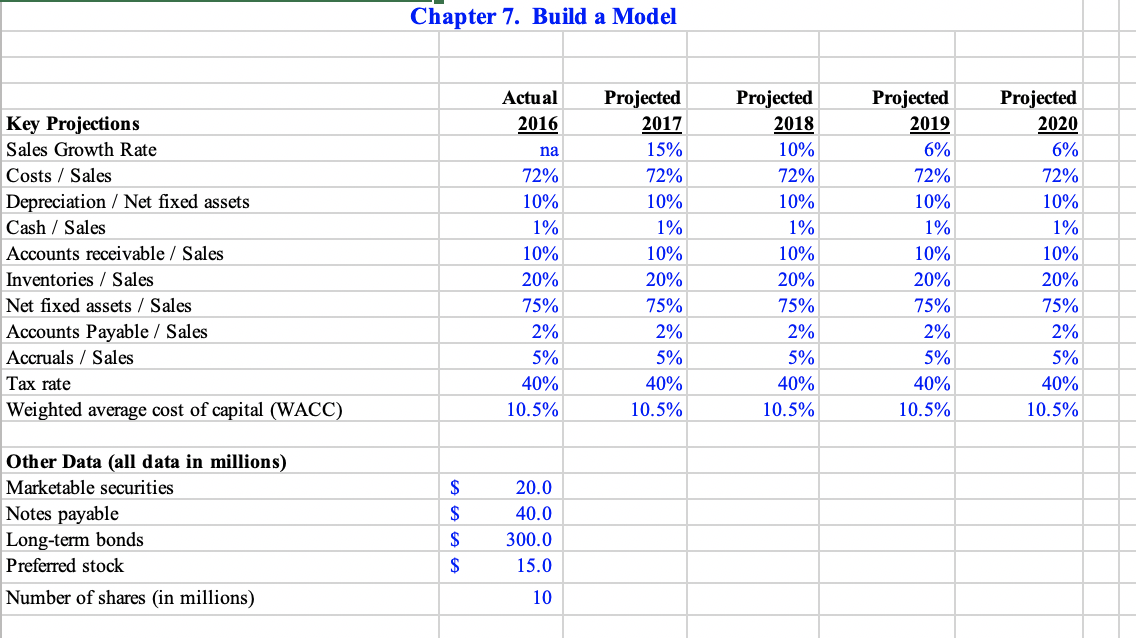
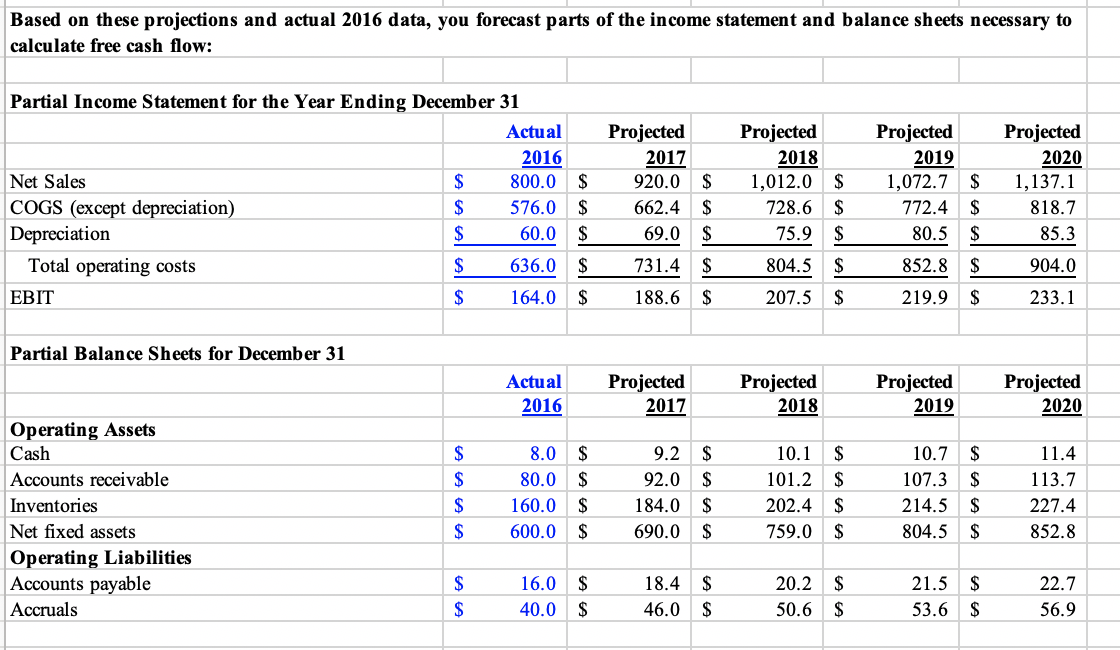
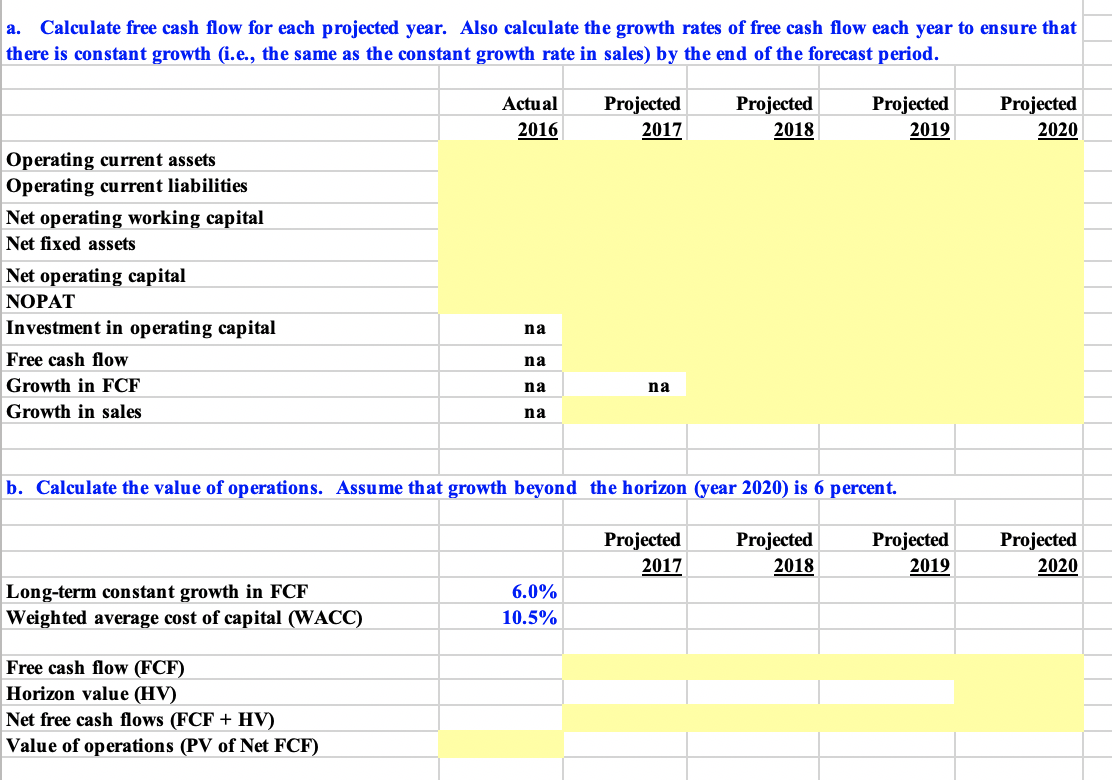
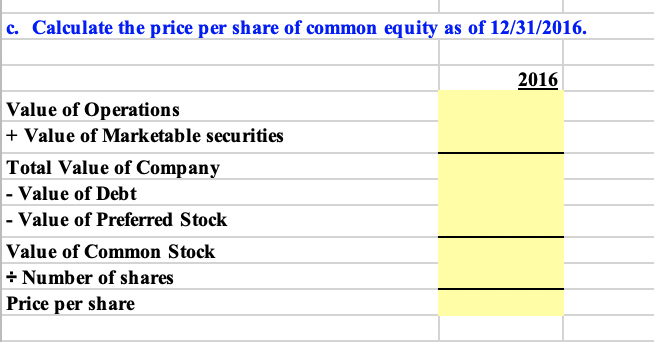
Chapter 7. Build a Model Projected 2020 6% Actual 2016 na 72% 10% 1% Projected 2017 15% 72% 10% 1% 10% 20% 75% 2% Projected 2018 10% 72% 10% 1% Projected 2019 6% 72% 10% 1% 72% 10% 1% 10% 10% 10% Key Projections Sales Growth Rate Costs/ Sales Depreciation / Net fixed assets Cash/ Sales Accounts receivable / Sales Inventories / Sales Net fixed assets / Sales Accounts Payable / Sales Accruals / Sales Tax rate Weighted average cost of capital (WACC) 10% 20% 75% 2% 5% 40% 10.5% 20% 75% 2% 5% 40% 10.5% 20% 75% 2% 5% 40% 10.5% 20% 75% 2% 5% 40% 10.5% 5% 40% 10.5% $ Other Data (all data in millions) Marketable securities Notes payable Long-term bonds Preferred stock Number of shares (in millions) 20.0 40.0 300.0 15.0 $ 10 Based on these projections and actual 2016 data, you forecast parts of the income statement and balance sheets necessary to calculate free cash flow: Projected 2017 Partial Income Statement for the Year Ending December 31 Actual 2016 Net Sales $ 800.0 COGS (except depreciation) 576.0 Depreciation $ 60.0 Total operating costs $ 636.0 EBIT $ 164.0 $ $ $ $ $ 920.0 662.4 69.0 731.4 188.6 $ $ $ $ $ Projected 2018 1,012.0 728.6 75.9 804.5 207.5 $ $ $ $ $ Projected 2019 1,072.7 772.4 80.5 852.8 219.9 $ $ $ $ $ Projected 2020 1,137.1 818.7 85.3 904.0 233.1 Partial Balance Sheets for December 31 Actual 2016 Projected 2017 Projected 2018 Projected 2019 Projected 2020 $ Operating Assets Cash Accounts receivable Inventories Net fixed assets Operating Liabilities Accounts payable Accruals 8.0 80.0 160.0 600.0 $ $ $ $ 9.2 92.0 184.0 690.0 $ $ $ $ 10.1 101.2 202.4 759.0 $ $ $ $ 10.7 107.3 214.5 804.5 $ $ $ $ 11.4 113.7 227.4 852.8 16.0 40.0 $ $ 18.4 46.0 $ $ 20.2 50.6 $ $ 21.5 53.6 $ $ 22.7 56.9 S a. Calculate free cash flow for each projected year. Also calculate the growth rates of free cash flow each year to ensure that there is constant growth (i.e., the same as the constant growth rate in sales) by the end of the forecast period. Actual 2016 Projected 2017 Projected 2018 Projected 2019 Projected 2020 Operating current assets Operating current liabilities Net operating working capital Net fixed assets Net operating capital NOPAT Investment in operating capital Free cash flow Growth in FCF Growth in sales na na na na na b. Calculate the value of operations. Assume that growth beyond the horizon (year 2020) is 6 percent. Projected 2017 Projected 2018 Projected 2019 Projected 2020 Long-term constant growth in FCF Weighted average cost of capital (WACC) 6.0% 10.5% Free cash flow (FCF) Horizon value (HV) Net free cash flows (FCF + HV) Value of operations (PV of Net FCF) c. Calculate the price per share of common equity as of 12/31/2016. 2016 Value of Operations + Value of Marketable securities Total Value of Company - Value of Debt - Value of Preferred Stock Value of Common Stock Number of shares Price per share Chapter 7. Build a Model Projected 2020 6% Actual 2016 na 72% 10% 1% Projected 2017 15% 72% 10% 1% 10% 20% 75% 2% Projected 2018 10% 72% 10% 1% Projected 2019 6% 72% 10% 1% 72% 10% 1% 10% 10% 10% Key Projections Sales Growth Rate Costs/ Sales Depreciation / Net fixed assets Cash/ Sales Accounts receivable / Sales Inventories / Sales Net fixed assets / Sales Accounts Payable / Sales Accruals / Sales Tax rate Weighted average cost of capital (WACC) 10% 20% 75% 2% 5% 40% 10.5% 20% 75% 2% 5% 40% 10.5% 20% 75% 2% 5% 40% 10.5% 20% 75% 2% 5% 40% 10.5% 5% 40% 10.5% $ Other Data (all data in millions) Marketable securities Notes payable Long-term bonds Preferred stock Number of shares (in millions) 20.0 40.0 300.0 15.0 $ 10 Based on these projections and actual 2016 data, you forecast parts of the income statement and balance sheets necessary to calculate free cash flow: Projected 2017 Partial Income Statement for the Year Ending December 31 Actual 2016 Net Sales $ 800.0 COGS (except depreciation) 576.0 Depreciation $ 60.0 Total operating costs $ 636.0 EBIT $ 164.0 $ $ $ $ $ 920.0 662.4 69.0 731.4 188.6 $ $ $ $ $ Projected 2018 1,012.0 728.6 75.9 804.5 207.5 $ $ $ $ $ Projected 2019 1,072.7 772.4 80.5 852.8 219.9 $ $ $ $ $ Projected 2020 1,137.1 818.7 85.3 904.0 233.1 Partial Balance Sheets for December 31 Actual 2016 Projected 2017 Projected 2018 Projected 2019 Projected 2020 $ Operating Assets Cash Accounts receivable Inventories Net fixed assets Operating Liabilities Accounts payable Accruals 8.0 80.0 160.0 600.0 $ $ $ $ 9.2 92.0 184.0 690.0 $ $ $ $ 10.1 101.2 202.4 759.0 $ $ $ $ 10.7 107.3 214.5 804.5 $ $ $ $ 11.4 113.7 227.4 852.8 16.0 40.0 $ $ 18.4 46.0 $ $ 20.2 50.6 $ $ 21.5 53.6 $ $ 22.7 56.9 S a. Calculate free cash flow for each projected year. Also calculate the growth rates of free cash flow each year to ensure that there is constant growth (i.e., the same as the constant growth rate in sales) by the end of the forecast period. Actual 2016 Projected 2017 Projected 2018 Projected 2019 Projected 2020 Operating current assets Operating current liabilities Net operating working capital Net fixed assets Net operating capital NOPAT Investment in operating capital Free cash flow Growth in FCF Growth in sales na na na na na b. Calculate the value of operations. Assume that growth beyond the horizon (year 2020) is 6 percent. Projected 2017 Projected 2018 Projected 2019 Projected 2020 Long-term constant growth in FCF Weighted average cost of capital (WACC) 6.0% 10.5% Free cash flow (FCF) Horizon value (HV) Net free cash flows (FCF + HV) Value of operations (PV of Net FCF) c. Calculate the price per share of common equity as of 12/31/2016. 2016 Value of Operations + Value of Marketable securities Total Value of Company - Value of Debt - Value of Preferred Stock Value of Common Stock Number of shares Price per share