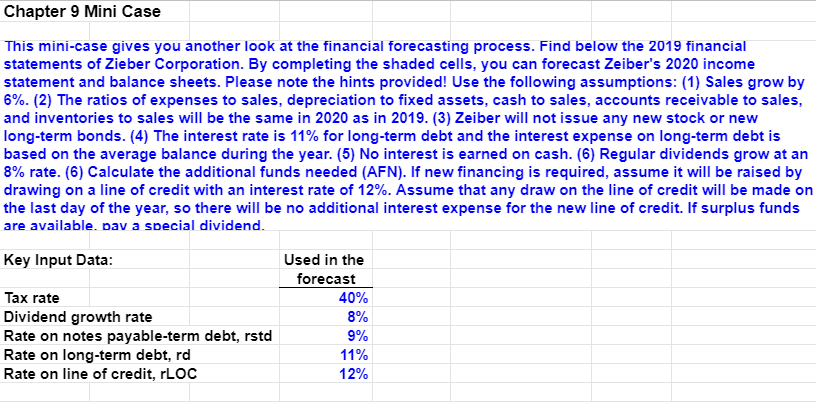
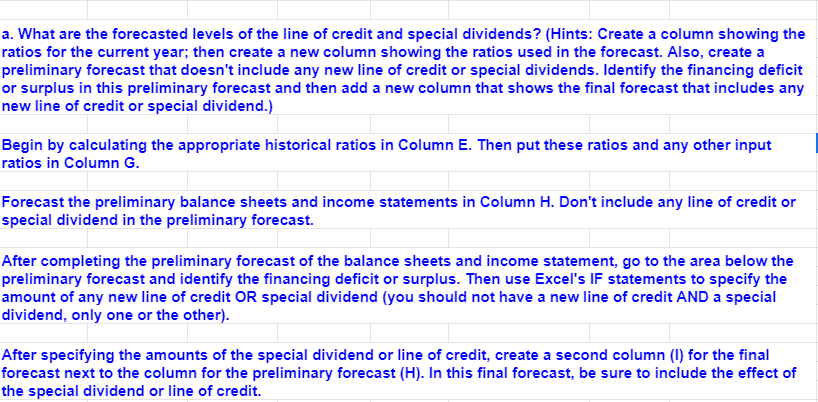
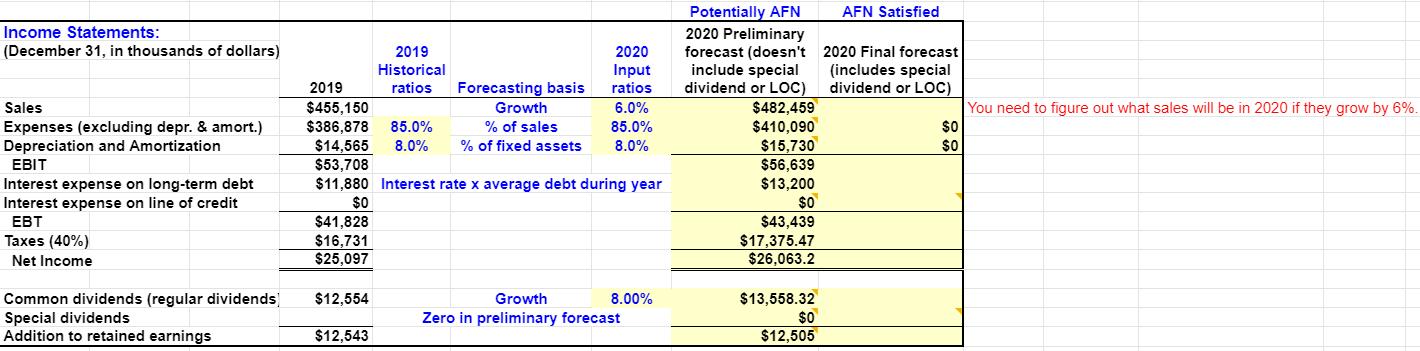
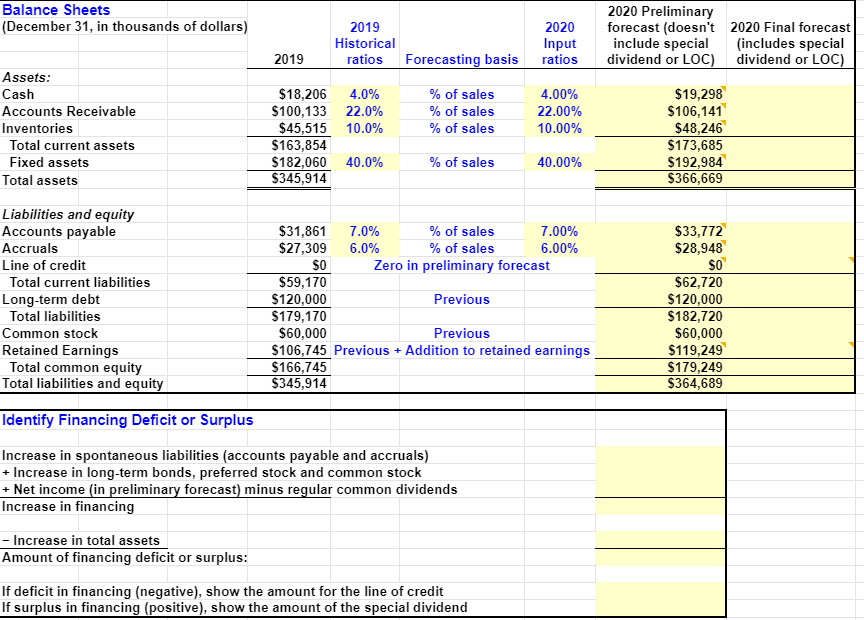
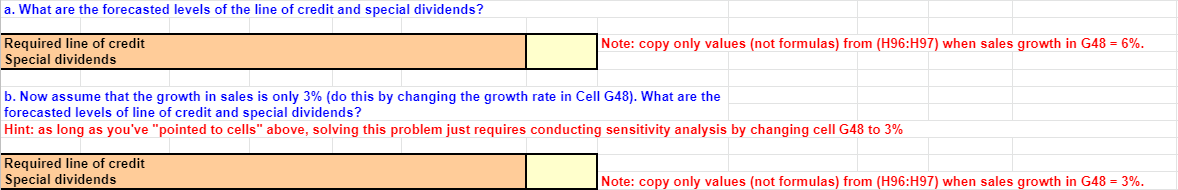
Chapter 9 Mini Case This mini-case gives you another look at the financial forecasting process. Find below the 2019 financial statements of Zieber Corporation. By completing the shaded cells, you can forecast Zeiber's 2020 income statement and balance sheets. Please note the hints provided! Use the following assumptions: (1) Sales grow by 6%. (2) The ratios of expenses to sales, depreciation to fixed assets, cash to sales, accounts receivable to sales, and inventories to sales will be the same in 2020 as in 2019. (3) Zeiber will not issue any new stock or new long-term bonds. (4) The interest rate is 11% for long-term debt and the interest expense on long-term debt is based on the average balance during the year. (5) No interest is earned on cash. (6) Regular dividends grow at an 8% rate. (6) Calculate the additional funds needed (AFN). If new financing is required, assume it will be raised by drawing on a line of credit with an interest rate of 12%. Assume that any draw on the line of credit will be made on the last day of the year, so there will be no additional interest expense for the new line of credit. If surplus funds are available. Dav a special dividend. Key Input Data: Tax rate Dividend growth rate Rate on notes payable-term debt, rstd Rate on long-term debt, rd Rate on line of credit, rLOC Used in the forecast 40% 8% 9% 11% 12% a. What are the forecasted levels of the line of credit and special dividends? (Hints: Create a column showing the ratios for the current year; then create a new column showing the ratios used in the forecast. Also, create a preliminary forecast that doesn't include any new line of credit or special dividends. Identify the financing deficit or surplus in this preliminary forecast and then add a new column that shows the final forecast that includes any new line of credit or special dividend.) Begin by calculating the appropriate historical ratios in Column E. Then put these ratios and any other input ratios in Column G. Forecast the preliminary balance sheets and income statements in Column H. Don't include any line of credit or special dividend in the preliminary forecast. After completing the preliminary forecast of the balance sheets and income statement, go to the area below the preliminary forecast and identify the financing deficit or surplus. Then use Excel's IF statements to specify the amount of any new line of credit OR special dividend (you should not have a new line of credit AND a special dividend, only one or the other). After specifying the amounts of the special dividend or line of credit, create a second column (l) for the final forecast next to the column for the preliminary forecast (H). In this final forecast, be sure to include the effect of the special dividend or line of credit. Income Statements: (December 31, in thousands of dollars) You need to figure out what sales will be in 2020 if they grow by 6%. 8.0% Potentially AFN AFN Satisfied 2020 Preliminary forecast (doesn't 2020 Final forecast include special (includes special dividend or LOC) dividend or LOC) $482.459 $410,090 $0 $15.730 $0 $56,639 $13,200 $0 $43,439 $17,375.47 $26,063.2 Sales Expenses (excluding depr. & amort.) Depreciation and Amortization EBIT Interest expense on long-term debt Interest expense on line of credit EBT Taxes (40%) Net Income 8.0% 2019 2020 Historical Input 2019 ratios Forecasting basis ratios $455,150 Growth 6.0% $386,878 85.0% % of sales 85.0% $14,565 % of fixed assets $53,708 $11,880 Interest rate x average debt during year $0 $41,828 $16,731 $25,097 $12,554 Common dividends (regular dividends Special dividends Addition to retained earnings Growth 8.00% Zero in preliminary forecast $13,558.32 $0 $12,505 $12,543 Balance Sheets (December 31, in thousands of dollars) 2019 Historical ratios forecasting basis 2020 Input ratios 2020 Preliminary forecast (doesn't 2020 Final forecast include special (includes special dividend or LOC) dividend or LOC) 2019 Assets: Cash Accounts Receivable Inventories Total current assets Fixed assets Total assets $18,206 4.0% $100,133 22.0% $45,515 10.0% $163,854 $182,060 40.0% $345,914 % of sales % of sales % of sales 4.00% 22.00% 10.00% $19,298 $106,141 $48,246 $173,685 $192,984 $366,669 % of sales 40.00% Liabilities and equity Accounts payable Accruals Line of credit Total current liabilities Long-term debt Total liabilities Common stock Retained Earnings Total common equity Total liabilities and equity $31,861 7.0% % of sales 7.00% $27,309 6.0% % of sales 6.00% $0 Zero in preliminary forecast $59,170 $120,000 Previous $179,170 $60,000 Previous $106,745 Previous + Addition to retained earnings $166,745 $345,914 $33,772 $28,948 $0 $62,720 $120,000 $182,720 $60,000 $119,249 $179,249 $364,689 Identify Financing Deficit or Surplus Increase in spontaneous liabilities (accounts payable and accruals) + Increase in long-term bonds, preferred stock and common stock + Net income (in preliminary forecast) minus regular common dividends Increase in financing - Increase in total assets Amount of financing deficit or surplus: If deficit in financing (negative), show the amount for the line of credit If surplus in financing (positive), show the amount of the special dividend a. What are the forecasted levels of the line of credit and special dividends? Note: copy only values (not formulas) from (H96:H97) when sales growth in G48 = 6%. Required line of credit Special dividends b. Now assume that the growth in sales is only 3% (do this by changing the growth rate in Cell G48). What are the forecasted levels of line of credit and special dividends? Hint: as long as you've "pointed to cells" above, solving this problem just requires conducting sensitivity analysis by changing cell G48 to 3% Required line of credit Special dividends Note: copy only values (not formulas) from (H96:H97) when sales growth in G48 = 3%. Chapter 9 Mini Case This mini-case gives you another look at the financial forecasting process. Find below the 2019 financial statements of Zieber Corporation. By completing the shaded cells, you can forecast Zeiber's 2020 income statement and balance sheets. Please note the hints provided! Use the following assumptions: (1) Sales grow by 6%. (2) The ratios of expenses to sales, depreciation to fixed assets, cash to sales, accounts receivable to sales, and inventories to sales will be the same in 2020 as in 2019. (3) Zeiber will not issue any new stock or new long-term bonds. (4) The interest rate is 11% for long-term debt and the interest expense on long-term debt is based on the average balance during the year. (5) No interest is earned on cash. (6) Regular dividends grow at an 8% rate. (6) Calculate the additional funds needed (AFN). If new financing is required, assume it will be raised by drawing on a line of credit with an interest rate of 12%. Assume that any draw on the line of credit will be made on the last day of the year, so there will be no additional interest expense for the new line of credit. If surplus funds are available. Dav a special dividend. Key Input Data: Tax rate Dividend growth rate Rate on notes payable-term debt, rstd Rate on long-term debt, rd Rate on line of credit, rLOC Used in the forecast 40% 8% 9% 11% 12% a. What are the forecasted levels of the line of credit and special dividends? (Hints: Create a column showing the ratios for the current year; then create a new column showing the ratios used in the forecast. Also, create a preliminary forecast that doesn't include any new line of credit or special dividends. Identify the financing deficit or surplus in this preliminary forecast and then add a new column that shows the final forecast that includes any new line of credit or special dividend.) Begin by calculating the appropriate historical ratios in Column E. Then put these ratios and any other input ratios in Column G. Forecast the preliminary balance sheets and income statements in Column H. Don't include any line of credit or special dividend in the preliminary forecast. After completing the preliminary forecast of the balance sheets and income statement, go to the area below the preliminary forecast and identify the financing deficit or surplus. Then use Excel's IF statements to specify the amount of any new line of credit OR special dividend (you should not have a new line of credit AND a special dividend, only one or the other). After specifying the amounts of the special dividend or line of credit, create a second column (l) for the final forecast next to the column for the preliminary forecast (H). In this final forecast, be sure to include the effect of the special dividend or line of credit. Income Statements: (December 31, in thousands of dollars) You need to figure out what sales will be in 2020 if they grow by 6%. 8.0% Potentially AFN AFN Satisfied 2020 Preliminary forecast (doesn't 2020 Final forecast include special (includes special dividend or LOC) dividend or LOC) $482.459 $410,090 $0 $15.730 $0 $56,639 $13,200 $0 $43,439 $17,375.47 $26,063.2 Sales Expenses (excluding depr. & amort.) Depreciation and Amortization EBIT Interest expense on long-term debt Interest expense on line of credit EBT Taxes (40%) Net Income 8.0% 2019 2020 Historical Input 2019 ratios Forecasting basis ratios $455,150 Growth 6.0% $386,878 85.0% % of sales 85.0% $14,565 % of fixed assets $53,708 $11,880 Interest rate x average debt during year $0 $41,828 $16,731 $25,097 $12,554 Common dividends (regular dividends Special dividends Addition to retained earnings Growth 8.00% Zero in preliminary forecast $13,558.32 $0 $12,505 $12,543 Balance Sheets (December 31, in thousands of dollars) 2019 Historical ratios forecasting basis 2020 Input ratios 2020 Preliminary forecast (doesn't 2020 Final forecast include special (includes special dividend or LOC) dividend or LOC) 2019 Assets: Cash Accounts Receivable Inventories Total current assets Fixed assets Total assets $18,206 4.0% $100,133 22.0% $45,515 10.0% $163,854 $182,060 40.0% $345,914 % of sales % of sales % of sales 4.00% 22.00% 10.00% $19,298 $106,141 $48,246 $173,685 $192,984 $366,669 % of sales 40.00% Liabilities and equity Accounts payable Accruals Line of credit Total current liabilities Long-term debt Total liabilities Common stock Retained Earnings Total common equity Total liabilities and equity $31,861 7.0% % of sales 7.00% $27,309 6.0% % of sales 6.00% $0 Zero in preliminary forecast $59,170 $120,000 Previous $179,170 $60,000 Previous $106,745 Previous + Addition to retained earnings $166,745 $345,914 $33,772 $28,948 $0 $62,720 $120,000 $182,720 $60,000 $119,249 $179,249 $364,689 Identify Financing Deficit or Surplus Increase in spontaneous liabilities (accounts payable and accruals) + Increase in long-term bonds, preferred stock and common stock + Net income (in preliminary forecast) minus regular common dividends Increase in financing - Increase in total assets Amount of financing deficit or surplus: If deficit in financing (negative), show the amount for the line of credit If surplus in financing (positive), show the amount of the special dividend a. What are the forecasted levels of the line of credit and special dividends? Note: copy only values (not formulas) from (H96:H97) when sales growth in G48 = 6%. Required line of credit Special dividends b. Now assume that the growth in sales is only 3% (do this by changing the growth rate in Cell G48). What are the forecasted levels of line of credit and special dividends? Hint: as long as you've "pointed to cells" above, solving this problem just requires conducting sensitivity analysis by changing cell G48 to 3% Required line of credit Special dividends Note: copy only values (not formulas) from (H96:H97) when sales growth in G48 = 3%