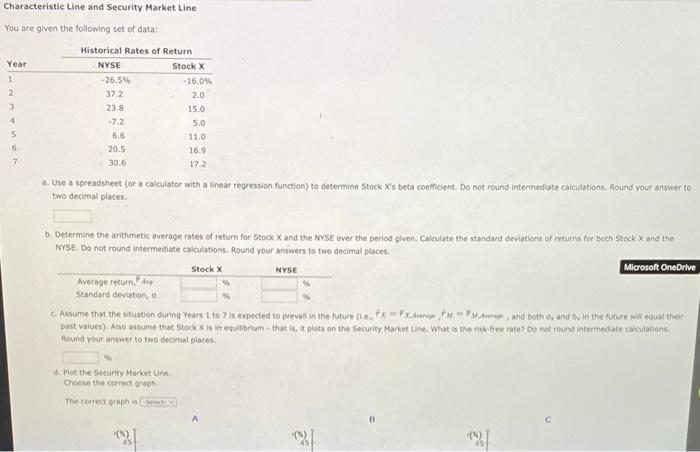
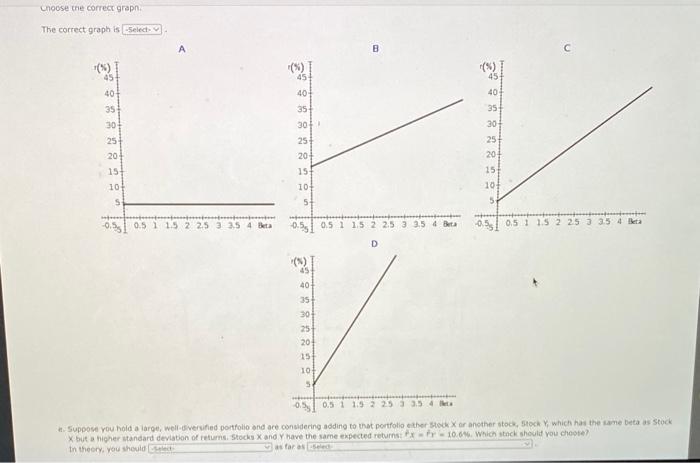
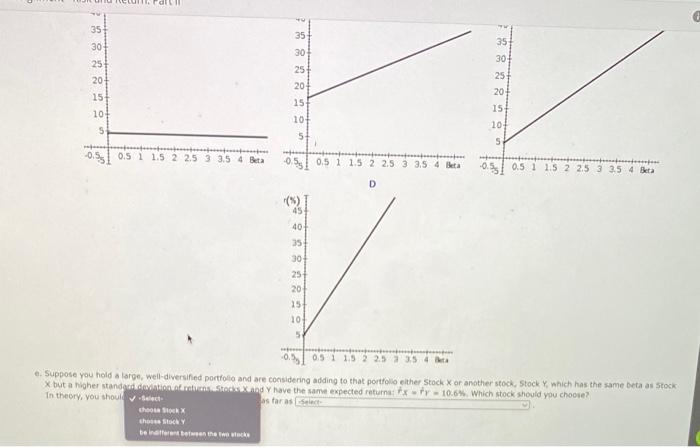
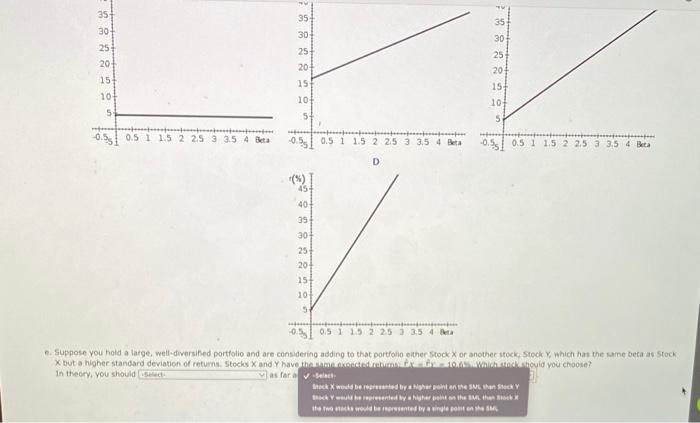
Characteristic Line and Security Market Line Youare given the following set of data: a. Use a spreadsheet (or a calculator with a linear regression function) to determine Stock X 's beta ceetficient. Do not round intermiediate caicilations. Aound your answer te two decimal places. b. Determine the arithmetic average rates of retum for Stock X and the NYse over the period given. Calculate the standard deviations of returms for both stock X and the NysE, Do not round intermediate calculations, Round your answers to two decimal places: past values). Aso assume that 5 tock is ir equalibelum - that is, it plots on the security Market une. What is the nisk-tree rate? bo not round intermediate calculations. Aound your answer to two decmal places. d. Plot the Iiecunty Merket Line. cheose the carrect graph. The cerrect graph is e. Suppose you hold a large, well-divervified portfolio and ace considering adding to that portfolio ether stock x or ancther stock, Stock Y which hat the sane beta as Stock X but a higher standart deviation of iatiums. Stocks X and y have the same ekpected returnst Px=1,10.646. Which stack should you cheote? in thecry, you shewid e. Suppose you hold a large, well-diversified portfolio and are considering adding to that portfollo either Stock X or another stock, stock Y, which has the same Deta as Stock: In theory, you shouli is taras ( e. Suppose you hold a large, well-diversifed portfolio and are considering adding to that portfoilo eltherstock x or another stock; Stock x, which hat the sume beta as Stock in theory, you should as far a r iseinet. Characteristic Line and Security Market Line Youare given the following set of data: a. Use a spreadsheet (or a calculator with a linear regression function) to determine Stock X 's beta ceetficient. Do not round intermiediate caicilations. Aound your answer te two decimal places. b. Determine the arithmetic average rates of retum for Stock X and the NYse over the period given. Calculate the standard deviations of returms for both stock X and the NysE, Do not round intermediate calculations, Round your answers to two decimal places: past values). Aso assume that 5 tock is ir equalibelum - that is, it plots on the security Market une. What is the nisk-tree rate? bo not round intermediate calculations. Aound your answer to two decmal places. d. Plot the Iiecunty Merket Line. cheose the carrect graph. The cerrect graph is e. Suppose you hold a large, well-divervified portfolio and ace considering adding to that portfolio ether stock x or ancther stock, Stock Y which hat the sane beta as Stock X but a higher standart deviation of iatiums. Stocks X and y have the same ekpected returnst Px=1,10.646. Which stack should you cheote? in thecry, you shewid e. Suppose you hold a large, well-diversified portfolio and are considering adding to that portfollo either Stock X or another stock, stock Y, which has the same Deta as Stock: In theory, you shouli is taras ( e. Suppose you hold a large, well-diversifed portfolio and are considering adding to that portfoilo eltherstock x or another stock; Stock x, which hat the sume beta as Stock in theory, you should as far a r iseinet


