| Charity # | Charity | Total Expenses ($) | Administrative Expenses (%) | Fundraising Expenses (%) | Program Expenses (%) |
| 1 | American Red Cross | 3357851633 | 3.9 | 3.9 | 92.2 |
| 2 | World Vision | 1202304323 | 3.9 | 7.6 | 88.4 |
| 3 | Smithsonian Institution | 1082224273 | 23.9 | 2.5 | 73.5 |
| 4 | Food For the Poor | 1050610325 | 0.6 | 2.2 | 96.8 |
| 5 | American Cancer Society | 1003275863 | 5.9 | 22.2 | 71.5 |
| 6 | Volunteers of America | 927086977 | 8.6 | 1.8 | 89.3 |
| 7 | Dana-Farber Cancer Institute | 878354899 | 12.9 | 1.4 | 85.1 |
| 8 | AmeriCares | 857538576 | 0.3 | 0.8 | 98.8 |
| 9 | ALSAC - St. Jude Children's Research Hospital | 830826382 | 9.4 | 16.9 | 73.2 |
| 10 | City of Hope | 737620643 | 13.8 | 3.1 | 83.1 |
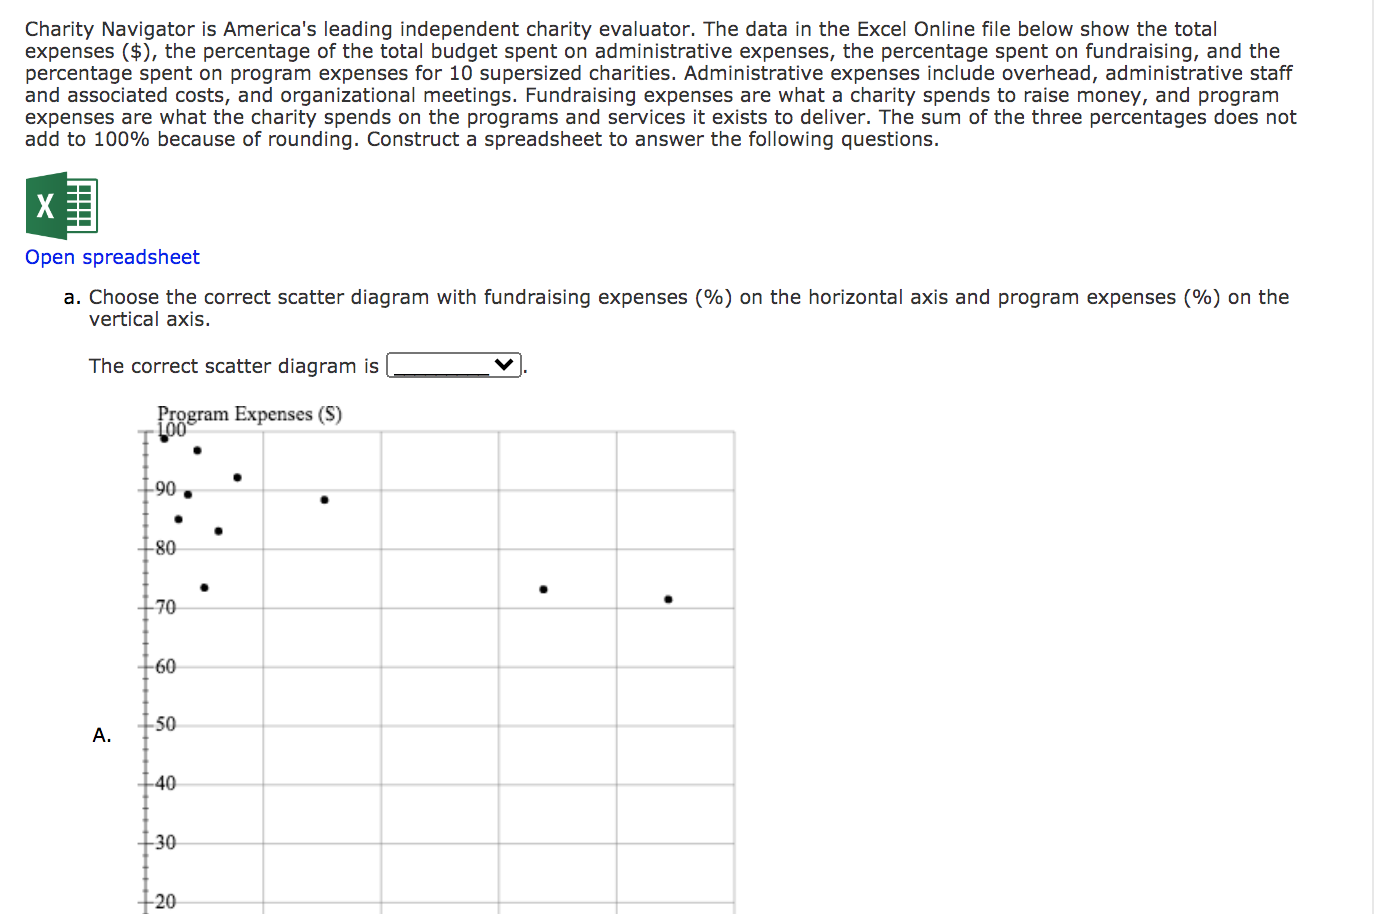
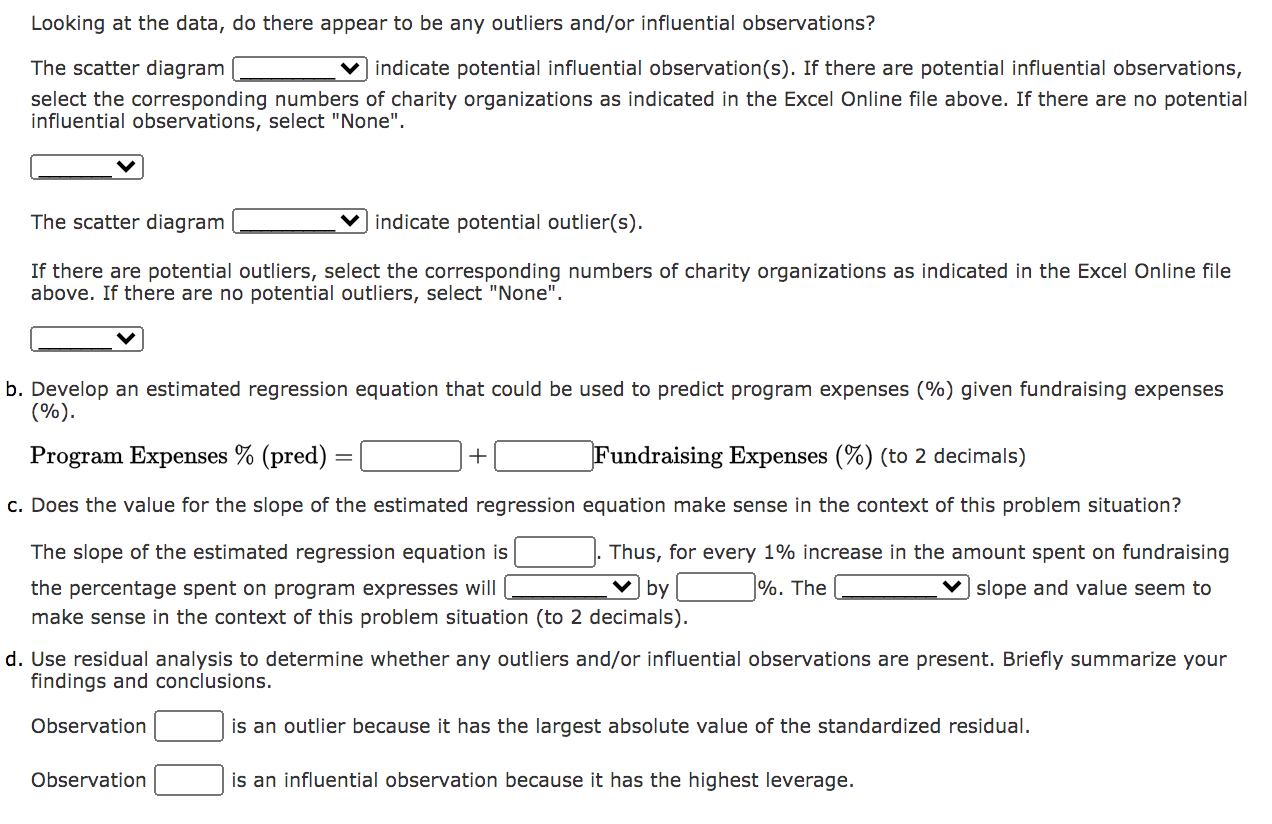
Charity Navigator is America's leading independent charity evaluator. The data in the Excel Online file below show the total expenses ($), the percentage of the total budget spent on administrative expenses, the percentage spent on fundraising, and the percentage spent on program expenses for 10 supersized charities. Administrative expenses include overhead, administrative staff and associated costs, and organizational meetings. Fundraising expenses are what a charity spends to raise money, and program expenses are what the charity spends on the programs and services it exists to deliver. The sum of the three percentages does not add to 100% because of rounding. Construct a spreadsheet to answer the following questions. X Open spreadsheet a. Choose the correct scatter diagram with fundraising expenses (%) on the horizontal axis and program expenses (%) on the vertical axis. The correct scatter diagram is Program Expenses (S) LOO 90 + 80 70 +60 50 A. -40 30 20 Looking at the data, do there appear to be any outliers and/or influential observations? The scatter diagram Vindicate potential influential observation(s). If there are potential influential observations, select the corresponding numbers of charity organizations as indicated in the Excel Online file above. If there are no potential influential observations, select "None". The scatter diagram indicate potential outlier(s). If there are potential outliers, select the corresponding numbers of charity organizations as indicated in the Excel Online file above. If there are no potential outliers, select "None". b. Develop an estimated regression equation that could be used to predict program expenses (%) given fundraising expenses (%). Program Expenses % (pred) = + Fundraising Expenses (%) (to 2 decimals) c. Does the value for the slope of the estimated regression equation make sense in the context of this problem situation? The slope of the estimated regression equation is Thus, for every 1% increase in the amount spent on fundraising the percentage spent on program expresses will %. The v slope and value seem to make sense in the context of this problem situation (to 2 decimals). by d. Use residual analysis to determine whether any outliers and/or influential observations are present. Briefly summarize your findings and conclusions. Observation is an outlier because it has the largest absolute value of the standardized residual. Observation is an influential observation because it has the highest leverage. Charity Navigator is America's leading independent charity evaluator. The data in the Excel Online file below show the total expenses ($), the percentage of the total budget spent on administrative expenses, the percentage spent on fundraising, and the percentage spent on program expenses for 10 supersized charities. Administrative expenses include overhead, administrative staff and associated costs, and organizational meetings. Fundraising expenses are what a charity spends to raise money, and program expenses are what the charity spends on the programs and services it exists to deliver. The sum of the three percentages does not add to 100% because of rounding. Construct a spreadsheet to answer the following questions. X Open spreadsheet a. Choose the correct scatter diagram with fundraising expenses (%) on the horizontal axis and program expenses (%) on the vertical axis. The correct scatter diagram is Program Expenses (S) LOO 90 + 80 70 +60 50 A. -40 30 20 Looking at the data, do there appear to be any outliers and/or influential observations? The scatter diagram Vindicate potential influential observation(s). If there are potential influential observations, select the corresponding numbers of charity organizations as indicated in the Excel Online file above. If there are no potential influential observations, select "None". The scatter diagram indicate potential outlier(s). If there are potential outliers, select the corresponding numbers of charity organizations as indicated in the Excel Online file above. If there are no potential outliers, select "None". b. Develop an estimated regression equation that could be used to predict program expenses (%) given fundraising expenses (%). Program Expenses % (pred) = + Fundraising Expenses (%) (to 2 decimals) c. Does the value for the slope of the estimated regression equation make sense in the context of this problem situation? The slope of the estimated regression equation is Thus, for every 1% increase in the amount spent on fundraising the percentage spent on program expresses will %. The v slope and value seem to make sense in the context of this problem situation (to 2 decimals). by d. Use residual analysis to determine whether any outliers and/or influential observations are present. Briefly summarize your findings and conclusions. Observation is an outlier because it has the largest absolute value of the standardized residual. Observation is an influential observation because it has the highest leverage