Answered step by step
Verified Expert Solution
Question
1 Approved Answer
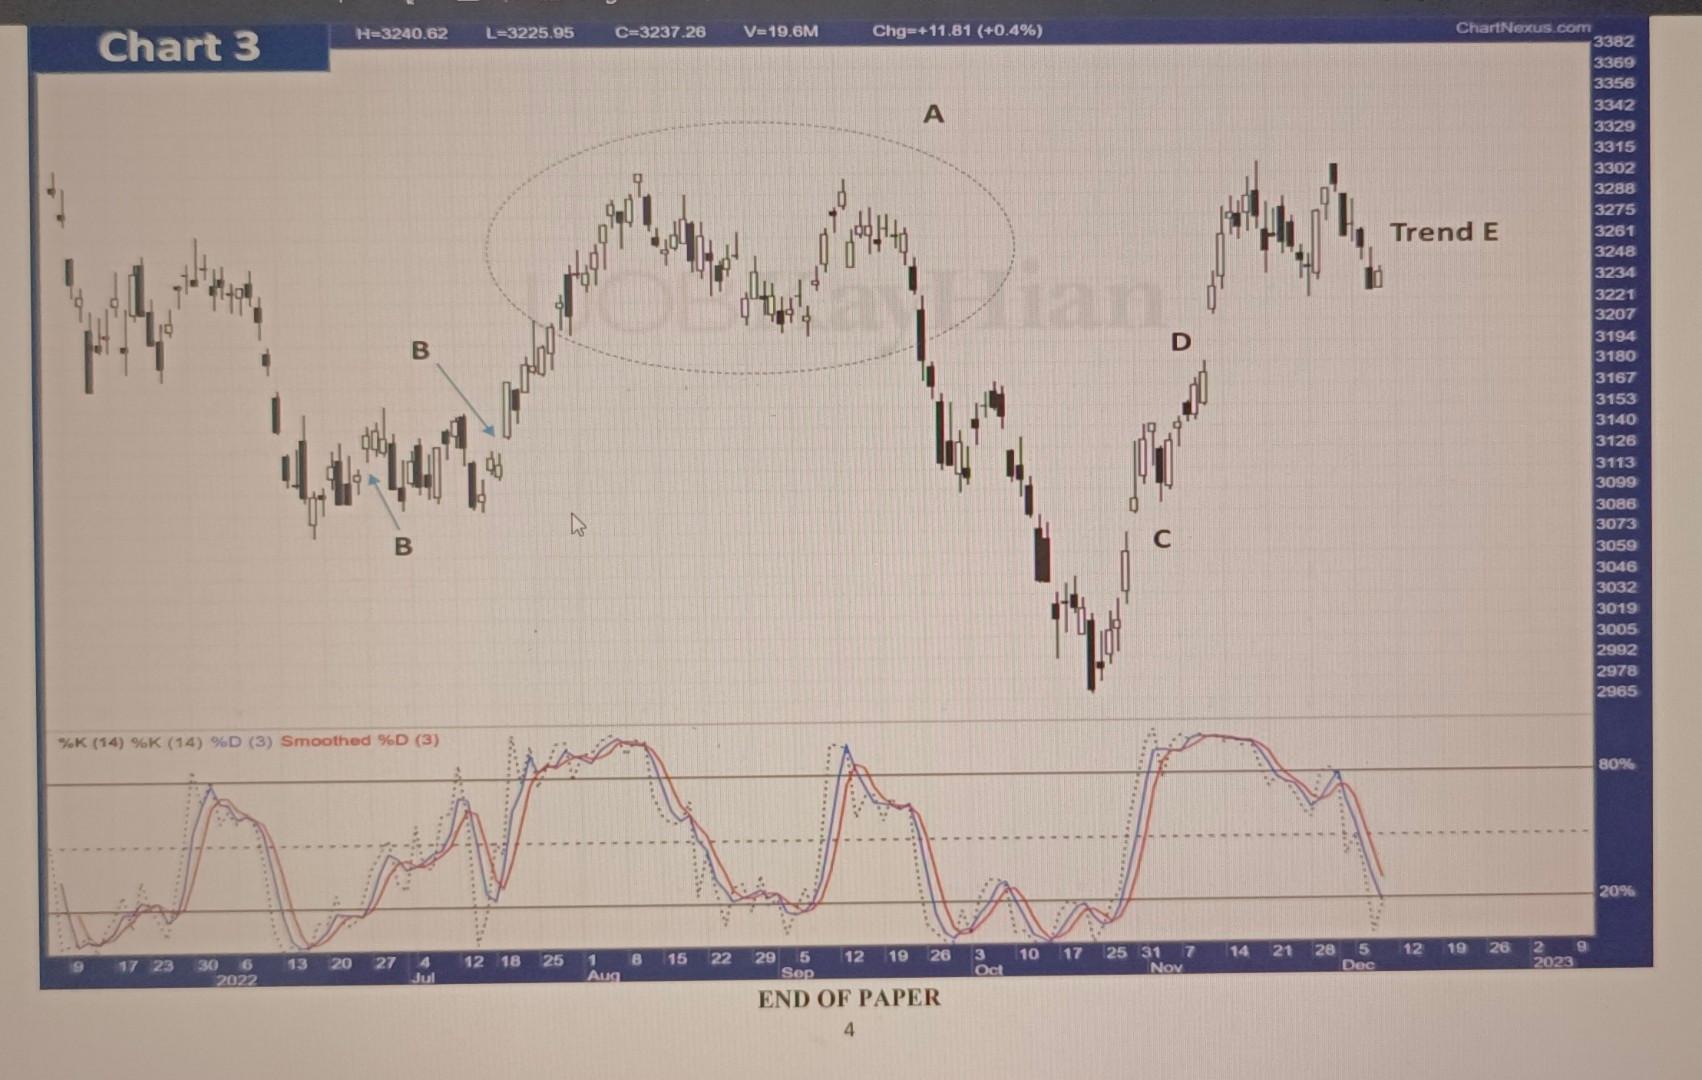
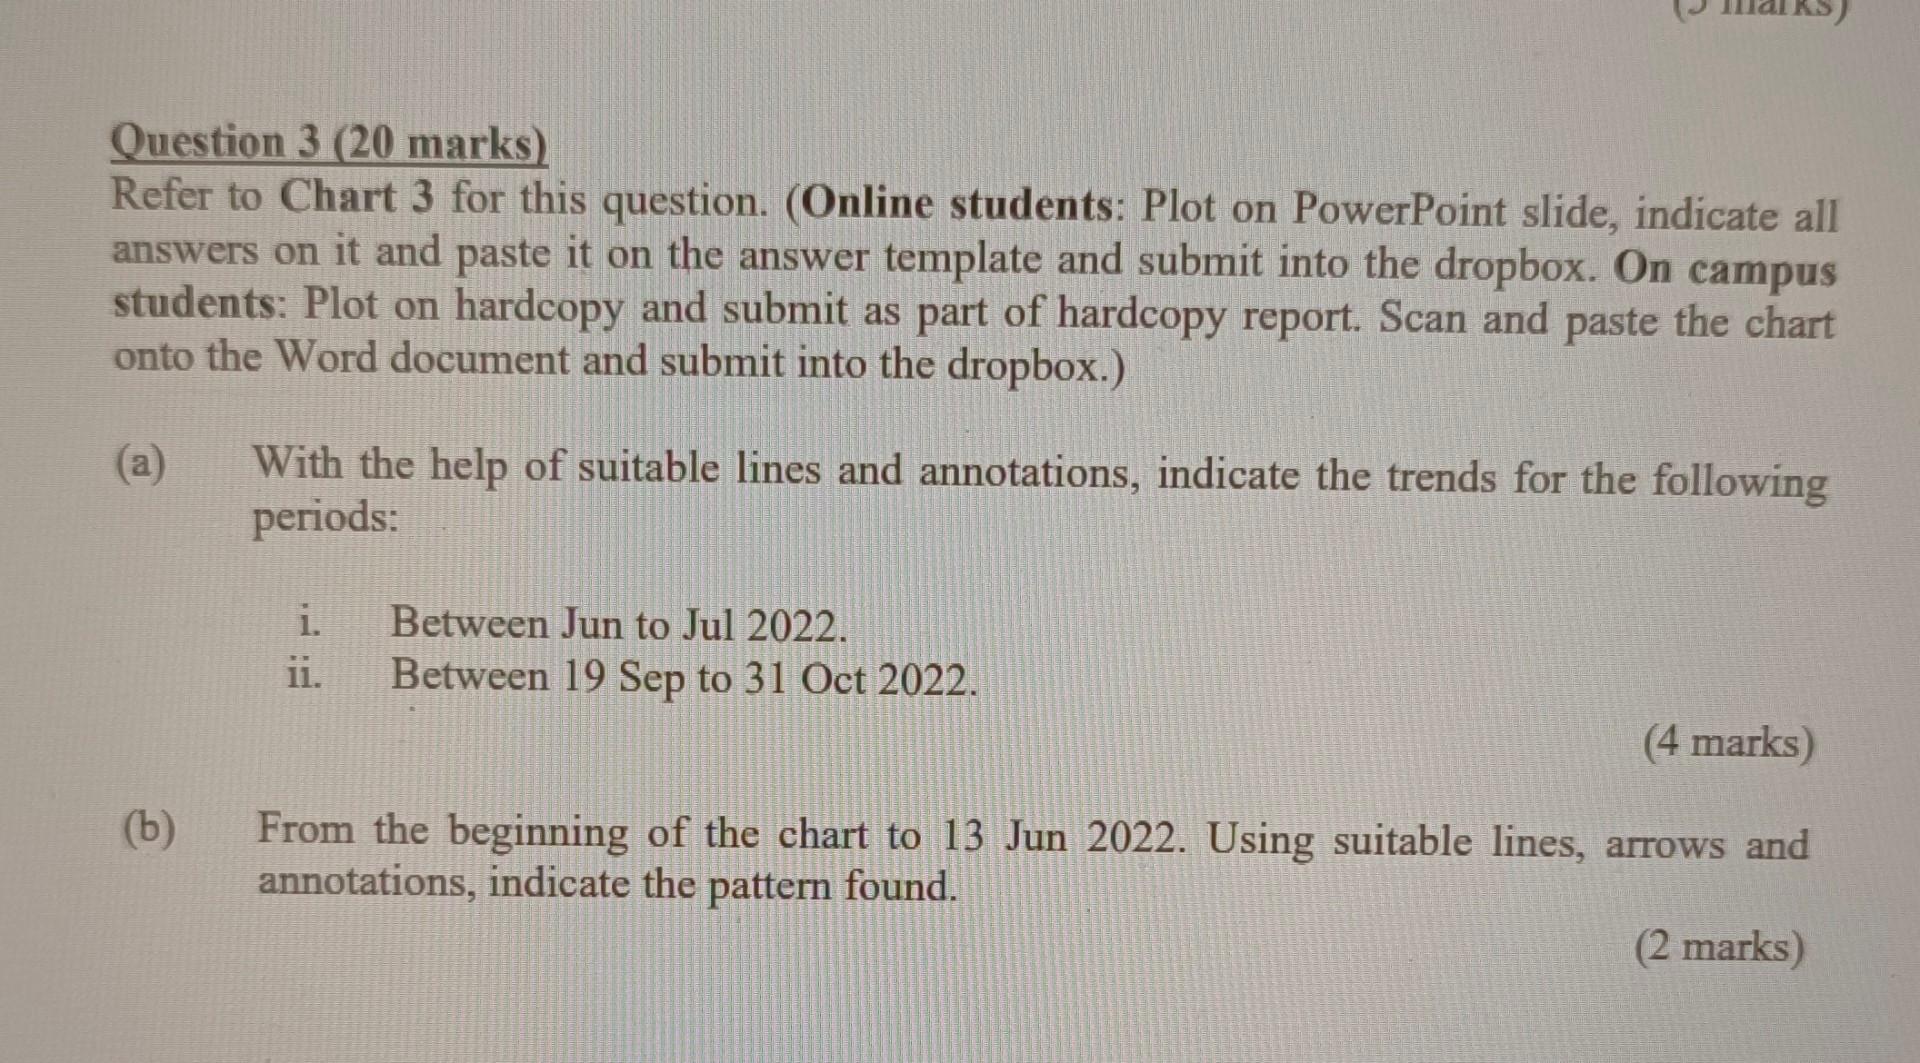
Chart 3 A END OF PAPER Question 3 (20 marks) Refer to Chart 3 for this question. (Online students: Plot on PowerPoint slide, indicate all


Chart 3 A END OF PAPER Question 3 (20 marks) Refer to Chart 3 for this question. (Online students: Plot on PowerPoint slide, indicate all answers on it and paste it on the answer template and submit into the dropbox. On campus students: Plot on hardcopy and submit as part of hardcopy report. Scan and paste the chart onto the Word document and submit into the dropbox.) (a) With the help of suitable lines and annotations, indicate the trends for the following periods: i. Between Jun to Jul 2022. ii. Between 19Sep to 31 Oct 2022. (4 marks) (b) From the beginning of the chart to 13 Jun 2022. Using suitable lines, arrows and annotations, indicate the pattern found. (2 marks)
Step by Step Solution
There are 3 Steps involved in it
Step: 1

Get Instant Access to Expert-Tailored Solutions
See step-by-step solutions with expert insights and AI powered tools for academic success
Step: 2

Step: 3

Ace Your Homework with AI
Get the answers you need in no time with our AI-driven, step-by-step assistance
Get Started


