Question: 5) Create a 3-D pie chart showing the breakdown of total Hours Worked into total Overtime Hours and the NonOvertime hours located at the bottom
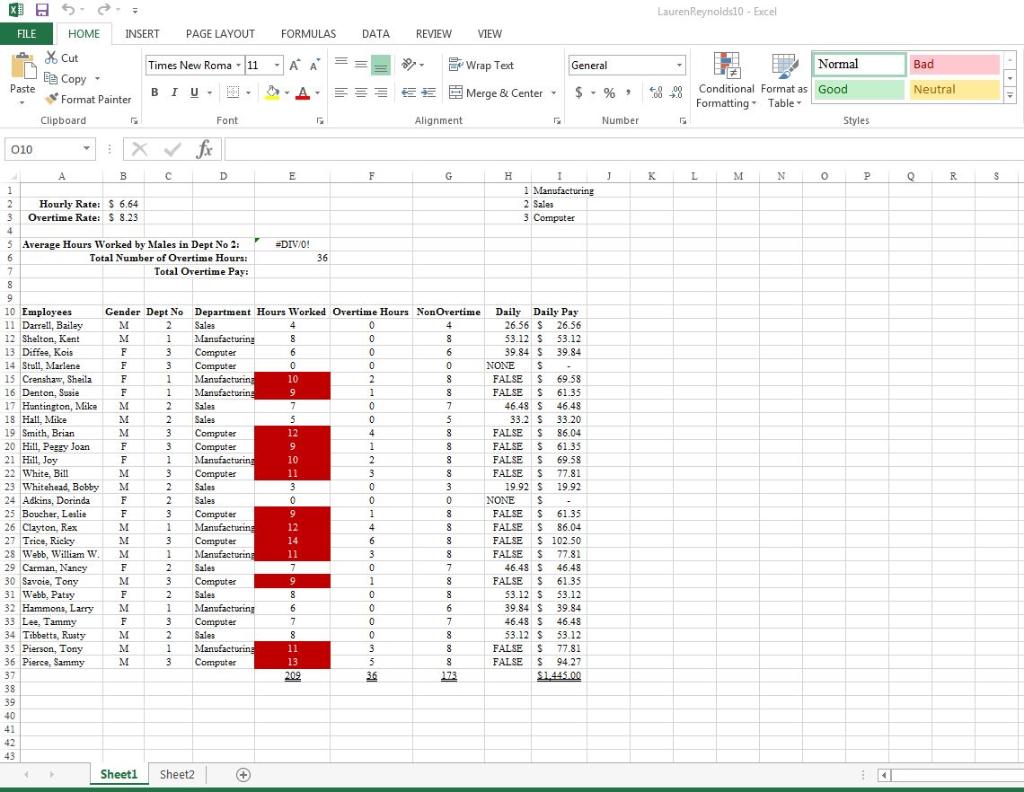
5) Create a 3-D pie chart showing the breakdown of total Hours Worked into total Overtime Hours and the NonOvertime hours located at the bottom of the database listing, row 37 columns E, F, G. The pie chart should show the values, the legend should indicate Overtime Hours and NonOvertime, and the chart title should be Total Daily Hours. Place this chart so that it will fill cells K1:R16.
6) DATA TABLE - Create a Data Table that shows the average Daily Pay by gender for each department number. Start the criteria in cell E40 and the data table in cell E44.
7) SUBTOTALS - Create a Subtotal showing the total hours worked by department and the total overtime hours worked by gender within each department. Change to Outline View 3. [Which department works the most hours and do you see something odd about the overtime hours?] Copy the subtotal information to Sheet 2 using Copy/Paste Special Values (previously undisplayed/hidden data will appear when copied to Sheet 2). Remove the Subtotaling on Sheet 1 using the Remove All button before continuing.
8) GOAL SEEK - In cell E7, place a formula that will multiply the Overtime Rate (B3) by the Total Number of Overtime Hours. Perform a Goal Seek to determine the overtime rate necessary to achieve $400 in total overtime pay. Leave the goal seek in place so that it can be graded.
9) EXTRACT (Advanced Filter) - Sort the database by the employees' names in ascending order. Extract just the name and the department number (Dept. No.) of those who worked more than 8 hours. Start the criteria in cell A40 and the extract output in cell A44.
10) DATA TABLE – on SHEET 3 create a One-Variable Data Table that will take the ODD numbers from 1 to 55 and will show each of the following independent calculations: multiply by $6.64; divide by 3.245; add $8.23 to each number; subtract 4 from each number.

XS FILE Paste 010 1 2 3 HOME X Cut E Copy - Format Painter Clipboard A Y B 10 Employees 11 Darrell, Bailey 12 Shelton, Kent 13 Diffee, Kois 14 Stull, Marlene 15 Crenshaw, Sheila 16 Denton, Susie 17 Huntington, Mike 18 Hall, Mike 19 Smith, Brian 20 Hill, Peggy Joan 21 Hill, Joy Hourly Rate: $ 6.64 Overtime Rate: $ 8.23 22 White, Bill 23 Whitehead, Bobby 38 39 40 24 Adkins, Dorinda 25 Boucher, Leslie 26 Clayton, Rex 27 Trice, Ricky 28 Webb, William W. 41 42 43 29 Carman, Nancy 30 Savoie, Tony 31 Webb, Patsy 4 5 Average Hours Worked by Males in Dept No 2: 6 Total Number of Overtime Hours: 7 Total Overtime Pay: 8 9 32 Hammons, Larry 33 Lee, Tammy 34 Tibbetts, Rusty 35 Pierson, Tony 36 Pierce, Sammy 37. 4 INSERT PAGE LAYOUT B X fx F F F F M M M F F M M F F M M Times New Roma 11 BIU M F M F M F C M M M 2 1 3 3 1 1 Font 2 3 2 2 3 3 1 3 2 Sales 2 Sales 3 1 3 1 2 1 3 2 1 3 D Manufacturing Computer Computer Manufacturina Manufacturing Sales Sales Computer Computer Manufacturing Computer Computer Manufacturing Computer Manufacturing Gender Dept No Department Hours Worked Overtime Hours NonOvertime M Sales 4 M 8 6 0 8 Sales Computer Sales Manufacturing Computer Sales Sheet1 Sheet2 Manufacturing Computer FORMULAS DATA + A A & A- E #DIV/0! 4 8 6 0 10 9 7 5 12 9 10 11 3 0 9 12 14 11 7 9 8 6 F 7 8 11 13 209 36 = E F 0 0 0 0 2 1 0 0 4 1 2 3 0 0 1 4 6 3 0 1 0 0 REVIEW 0 0 3 5 36 EE Alignment G 8 7 5 8 8 8 8 3 0 8 8 8 8 7 8 8 6 7 8 8 VIEW 8 173 Wrap Text Merge & Center H Daily 26.56 S 53.12 S 39.84 NONE General I 1 Manufacturing 2 Sales 3 Computer $%9 Daily Pay 26.56 53.12 39.84 FALSE $ 53.12 S 39.84 $ S 46.48 S S FALSE S FALSE S 46.48 S 33.2 S FALSE $ FALSE $ FALSE S FALSE $ 19.92 $ NONE $ FALSE $ 61.35 FALSE $ 86.04 FALSE $ 102.50 FALSE S 77.81 46.48 S 46.48 61.35 53.12 39.84 46.48 53.12 77.81 FALSE $ 94.27 53.12 $ FALSE S $1.445.00 69.58 61.35 46.48 33.20 86.04 61.35 69.58 77.81 19.92 Number J LaurenReynolds10 - Excel .00 .0 K G Normal Conditional Format as Good Formatting Table L M - N O Styles P A Bad Neutral Q R $
Step by Step Solution
3.63 Rating (201 Votes )
There are 3 Steps involved in it
NO5 PIE CHART TOTAL AVERAG... View full answer

Get step-by-step solutions from verified subject matter experts


