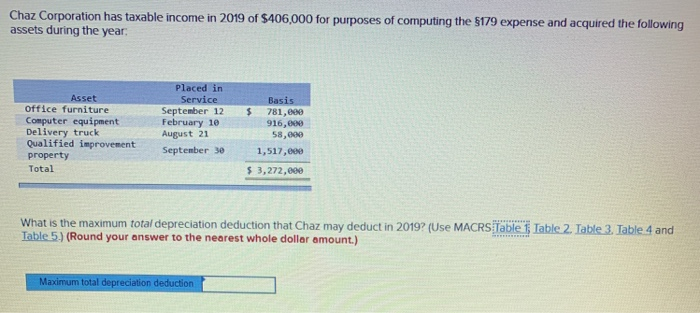
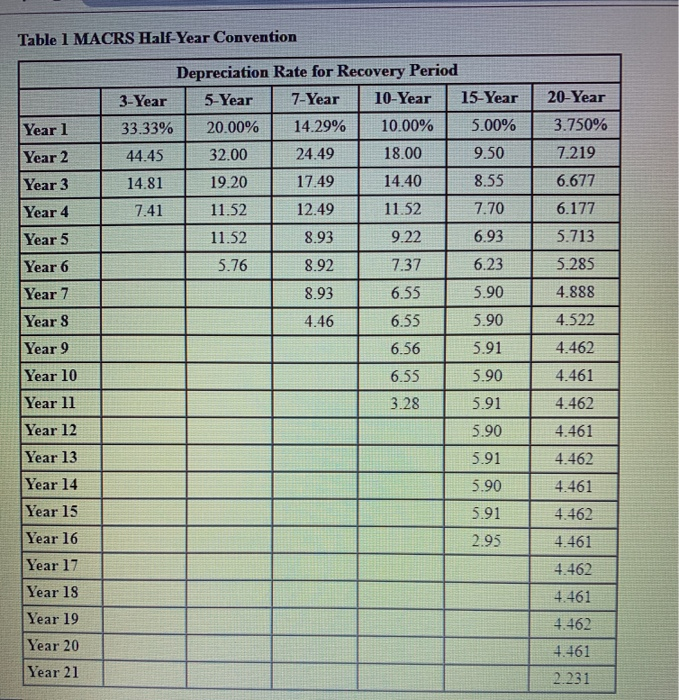
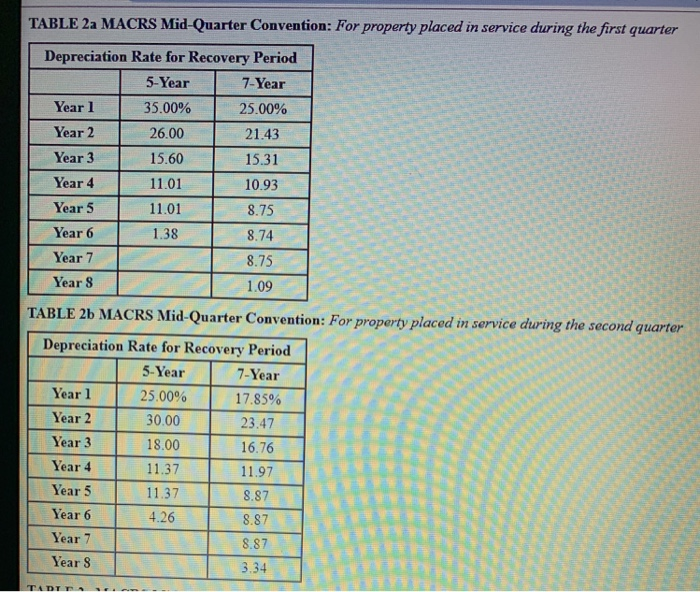
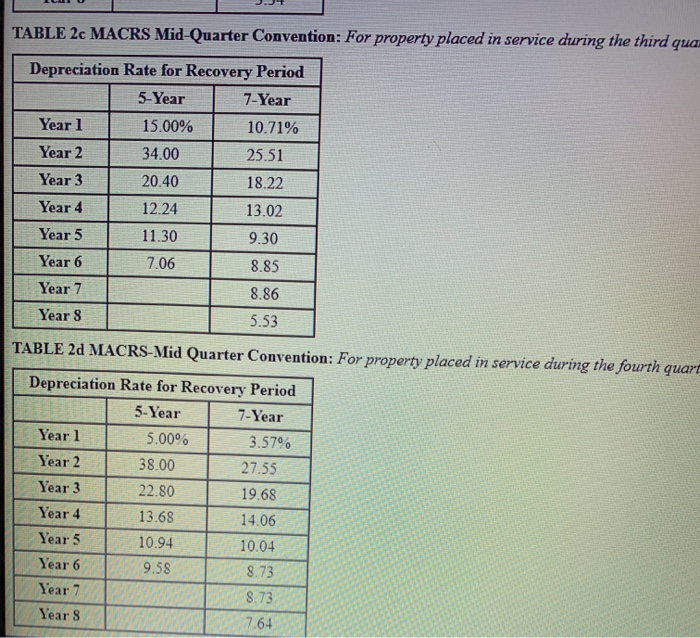
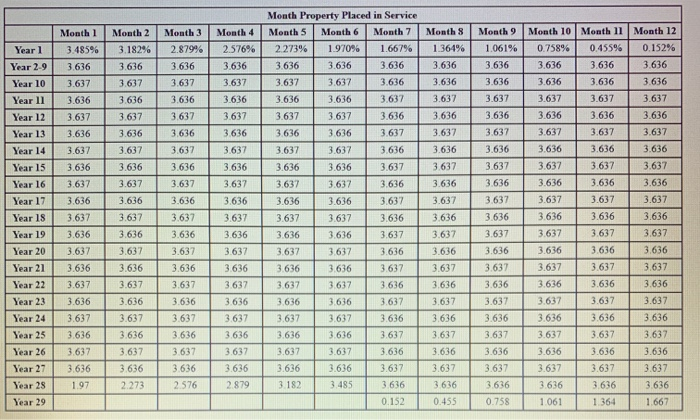
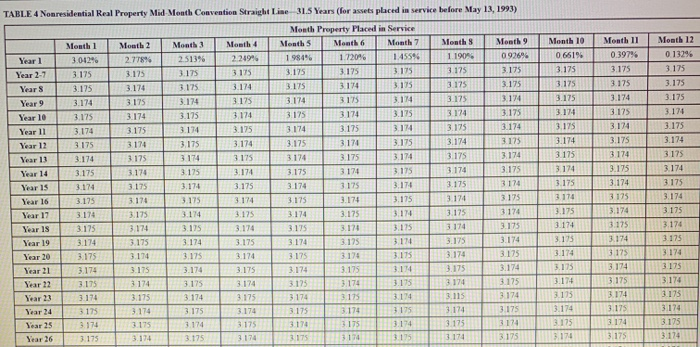
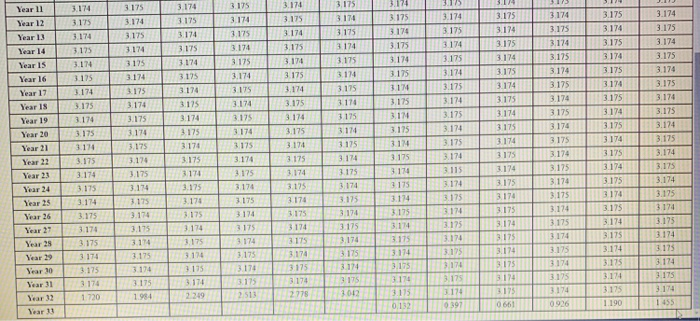
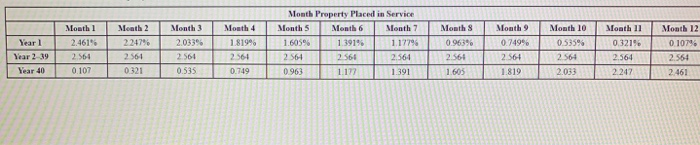
Chaz Corporation has taxable income in 2019 of $406,000 for purposes of computing the 5179 expense and acquired the following assets during the year, Asset Office furniture Computer equipment Delivery truck Qualified improvement property Total Placed in Service September 12 5 February 10 August 21 September 301 Basis 781,600 916,000 58,000 ,517,000 $ 3,272,000 What is the maximum total depreciation deduction that Chaz may deduct in 2019? (Use MACRS Table 1 Table 2. Table 3. Table 4 and Table 5.) (Round your answer to the nearest whole dollar amount.) Madmum total depreciation deduction | 8 Table 1 MACRS Half-Year Convention Depreciation Rate for Recovery Period 3-Year 5-Year 7-Year 10-Year 15-Year Yearl 33.33% 20,00% 14.29% 10.00% 5.00% Year 2 4 4.45 32.00 24.49 18.00 9.50 Year 3 14.81 19.20 17.49 14.40 8.55 Year 4 7.41 11.52 12.49 11.52 7.70 Year 5 11.52 8.93 9.22 6.93 Year 6 5.76 8.92 7.37 6.23 Year 7 8.93 6.55 5.90 Year 4 .46 6.55 5.90 Year 9 | 6.56 5.91 Year 10 6.55 5.90 Year 11 3.285.91 Year 12 L 5.90 Year 13 5 .91 Year 14 5.90 Year 15 5.91 Year 16 T 2.95 Year 17 Year 18 Year 19 Year 20 Year 21 20-Year 3.750% 7.219 6.677 6.177 5.713 5.285 4.888 4.522 4.462 4.461 4.462 4.461 4.462 4.461 4.462 4.461 I 4.461 4.462 4.461 2.231 TABLE 2a MACRS Mid-Quarter Convention: For property placed in service during the first quarter - 19 Depreciation Rate for Recovery Period 5-Year 7-Year Year 1 35.00% 25.00% Year 2 2 6.00 21.43 Year 3 15.60 15.31 Year 4 11.01 10.93 Year 5 11.01 8.75 T Year 6 1.38 8.74 Year 7 8.75 Year 8 1.09 TABLE 26 MACRS Mid-Quarter Convention: For property placed in service during the second quarter Depreciation Rate for Recovery Period I 5-Year 7-Year Year 1 25.00% 17.85% Year 2 30.00 23.47 Year 3 18.00 16.76 Year 4 11.37 11.97 Year 5 8.87 Year 6 Year 7 8.87 Year 8 3 .34 00 8.87 TAD TABLE 2c MACRS Mid-Quarter Convention: For property placed in service during the third qua Depreciation Rate for Recovery Period 5-Year 7-Year Yearl 15.00% 10.71% Year 2 34.00 25.51 Year 3 20.40 18.22 Year 4 12.24 13.02 Year 5 11.30 9.30 Year 6 7.06 8.85 Year 7 8.86 Year 8 5.53 TABLE 2d MACRS-Mid Quarter Convention: For property placed in service during the fourth quart Depreciation Rate for Recovery Period 5-Year 7-Year 1 Yearl 5.00% 3.57% 1 Year 2 38.00 27.55 1 Year 3 22.80 L 19.68 Year 4 13.68 14.06 Year 5 10.94 10.04 Year 6 9. 588.73 7 Year 8 .73 8 Year 7 .64 Month Property Placed in Service Month 10 Month 11 Month 12 Month 9 Month 5 Month 6 Month 7 Month 8 Month 1 onth 2 Month 3 Month 4 1.364 % 0.152% 3.182 % 2.879 % 1061% 0.758% 0.455% 3.485% 2.576% 2.273% 1.970% 1.667% Year 1 3.636 3.636 3.636 3.636 3.636 3.636 3.636 3.636 3.636 3.636 3.636 Year 2-9 3.636 3.636 3.636 3.637 3.637 3.636 3.636 3.636 3.636 3.637 3.637 3.637 Year 10 3.637 3.636 3.637 3.637 3.637 3.637 3.636 3.636 3.637 3.637 Year l1 3.636 3.636 3.636 3.637 3.637 3.636 3.636 3.636 3.636 3.636 3.637 3.637 3.637 3.636 Year 12 3.637 3.636 3.637 3.637 3.637 3.637 3.636 3.636 3.636 3.637 3.637 Year 13 3.636 3.636 3.636 3.636 3.636 3.636 3.636 3.637 3.637 3.637 3.637 3.637 3.637 3.636 Year 14 3.637 3.636 3.637 3.637 3.637 3.637 3.637 3.636 3.636 3.636 3.636 3.636 Year 15 3.636 3.636 3.637 3.636 3.636 3.636 3.636 Year 16 3.637 3.637 3.637 3.637 3.637 3.637 3.637 3.637 3.637 3.637 Year 17 3.636 3.636 3.636 3.636 3.636 3.636 3.637 3.636 3.636 3.636 3.637 3.637 3.636 3.636 3.636 Year 18 3.637 3.637 3.637 3.637 3.637 3.637 3.637 Year 19 3.636 3.636 3.636 3.637 3.637 3.636 3.636 3.636 3.637 3.636 3.636 3.636 Year 20 3.637 3.637 3.637 3.636 3.636 3.636 3.637 3.637 3.637 3.636 3.637 3.637 3.637 Year 21 3.636 3.636 3.636 3.636 3.636 3.637 3.637 3.637 3.636 3.636 3.636 Year 22 3.637 3.637 3.637 3.637 3.637 3.637 3.636 3.636 3.636 3.636 3.637 3.637 3.637 Year 23 3.636 3.636 3.636 3.637 3.637 3.636 3.636 3.637 3.636 Year 24 3.636 3.636 3.637 3.637 3.637 3.637 3.637 3.637 3.636 3.636 3.636 3.637 3.637 3.637 Year 25 3.636 3.636 3.636 3.636 3.636 3.636 3.637 3.637 3.637 Year 26 3.637 3.637 3.636 3.636 3.636 3.636 3.636 3.637 3.637 3.637 3.637 3.636 3.636 3.637 3.636 3.636 3.636 3.636 3.636 3.637 3.637 3.637 3.637 3.637 Year 27 2.576 3.636 Year 28 2.273 2879 3.182 3.485 3.636 3.636 3.636 3.636 3.636 1.97 Year 29 0.455 0.758 1.061 1.667 0.152 1.364 3170 15 TABLE 4 Nonresidential Real Property Mid Mouth Convention Straight Line 31.5 Years (for wts placed in Mrvice before May 13, 1993) Month Property Placed in Service Month 2 Month 3 Month 1 Month 4 Month 3 Month 6 Months 7 Month 10 Months 1 Month 9 Month II Month 12 Yearl 98496 30124277922513962210 1.7201 1.45596 1 1909 0.619 0 9269 0.397% 013296 Year 2.7 3175 1125 375 3115 3.175 3 175 175 3125 31751 175 3.175 3.175 Years 117 3.175 31753 174 175 317 11753 1175 175 31751 175 Year 9 3 174 175 174 3174 14 3.175 31753 174 175 Year 10 3175 3175 174 175 3 15 3.174 3.175 3 174 3.175 3174 Year 11 3 174 175 3 174 1174 3.175 3194 31753 174 3175 3.174 1175 Year 1 3175 31753 174 175 3174 3.174 3175 3.174 3.175 3.174 Year 133 174 11753 174 175 174 3.175 3174 3.175 3174 3174 3175 Year 14 3 175 174 175 174 175 3 174 3.175 3 174 3.175 3174 3.175 1 3.174 Year 1 3 .174 175 3,174 175 3174 3175 3.175 3174 3.175 3.174 175 Year 16 3.175 5175 3 174 3175 3174 175 3.174 3174 175 176 3125 Vear 173 174 11 1 3.175 174 175 3174 3.175 3 174 BI 5 3.174 175 Year IS 3175 3171 3115 314 315 31 3115 3175 174 175 176 Year 19 3 174 175 174 175 3.125 31 3.175 3 174 175 174 175 Sear20 11 3175 3170 3175 176 317 315 3114 3 175 3 174 Year 21 3174 175 174 175 317 3175 114 3.175 3.174 15 3.174 175 Year 22 3175 174 175 174 31753 174 124 3175 3 175 3.174 Year? 314 3175 3 174 3.17 3.115 3 174 175 Year 24 3175 174 175 1 3 .174 Year 25 3.174 175 174 175 317 3.175 114 Year 26 3173 174 175 3174 3175 1 3175 1175 176 173 3.174 3174 3.175 3.175 3174 175 176 3175 3 174 3.175 174 3.175 3.174 3 174 1175 3.175 314 3.174 3125 3.175 3174 1175 174 3.175 3175 175 3174 3.175 T I 3. 175 Vear Il 174 Year 12 3 175 Year 13 3 174 Year 14 3 175 Year 15 1 74 Year 16 1175 Year 173 174 Year IS 3175 Year 1914 Year 20 1 75 Year 21 1 174 Year 22 175 Year 23 174 Year 24 175 3175 175 1 3 .174 3174 1125 3.175 3.174 3.174 3.174 3.175 175 3.174 3.174 3.175 175 13 .174 174 3.175 1753 174 3174 175 317 3174 3175 175 174 316 3175 1743 3.175 13174 175 174 174 1175 175 1 3.174 112 174 1175 175 174 174 175 175 174 174 175 31753 174 174 175 175 176 3.174 3 175 175 174 314 315 173 174 174 175 175 174 1174 IM 3.175 114 3174 1175 3114 1125 175 315 3174 3175 3174 3.174 3.175 3.174 3.175 3.174 3.175 3174 175 3171 3174 3175 3.17 1.175 3175 3174 3175 117 1115 1174 3175 3.174 175 3178 3175 3.114 1175 1114 Year 25 Year 26 .174 175 175 174 175 3171 175 3175 317 3175 174 3.175 3175 3175 3.174 3.173 3124 Year 27 3 174 3175 3174 3.175 Year 25 Year 3 175 1 3194 1 1 175 1 174 1 3175 17 175 3 175 3.174 Year 30 Year 1 Year 3) .175 174 174 175 1720194 3.175 31 176 29 511 OLI 091190 Yearl Year 2 39 Month 1 2.461 2564 Month 2 2 24796 2561 Month 3 2033% 2561 0.535 Month 4 1.819% 2561 Month Property Placed in Service Month 3 Month 6 Month 7 1.605% 139196 1.12796 2561 2566 2564 .963 1177 1.391 Month 8 0.963% 2.564 1.6051 Month 9 0.749 2.564 1.819 Month 10 0 535% 2564 2.033 Month 11 0.321% 2,564 247 Month 12 0 107% .564 2.461 2 Year 40 0 107 0 321 0.749 0 2