

Answered step by step
Verified Expert Solution
Question
1 Approved Answer
CHCCR my w Presented in the bar charts are three columns for each of the first three years of a company's operations. The three columns
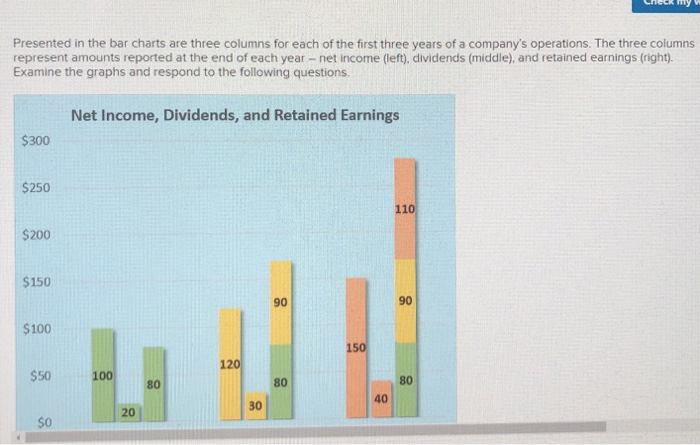
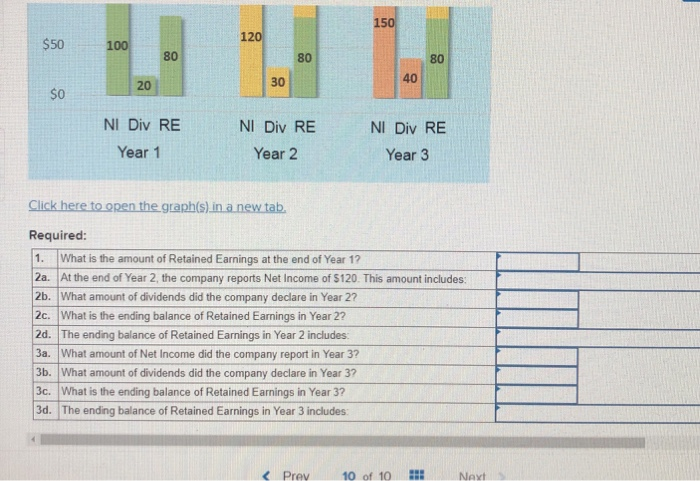 CHCCR my w Presented in the bar charts are three columns for each of the first three years of a company's operations. The three columns represent amounts reported at the end of each year - net income (left), dividends (middle), and retained earnings (right). Examine the graphs and respond to the following questions. Net Income, Dividends, and Retained Earnings $300 $250 $200 $150 $100 $50 100 100 NI Div RE Year 1 NI Div RE Year 2 NI Div RE Year 3 Click here to open the graph(s) in a new tab. Required: 1. What is the amount of Retained Earnings at the end of Year 1? 2a. At the end of Year 2 the company reports Net Income of $120. This amount includes: 2b. What amount of dividends did the company declare in Year 2? 2c. What is the ending balance of Retained Earnings in Year 2? 2d. The ending balance of Retained Earnings in Year 2 includes 3a. What amount of Net Income did the company report in Year 3? 3b. What amount of dividends did the company declare in Year 3? 3c. What is the ending balance of Retained Earnings in Year 3? 3d. The ending balance of Retained Earnings in Year 3 includes: Prev 10 of 10 8
Step by Step Solution
There are 3 Steps involved in it
Step: 1

Get Instant Access with AI-Powered Solutions
See step-by-step solutions with expert insights and AI powered tools for academic success
Step: 2

Step: 3
Ace Your Homework with AI
Get the answers you need in no time with our AI-driven, step-by-step assistance
Get Started